阻止编译器优化:
go build -gcflags -l -o myserver main.go
package main

import (
    "flag"
    "fmt"
    "log"
    "net/http"
    _ "net/http/pprof"
    "os"
    "runtime"
    "runtime/pprof"
    "time"
)

var cpuprofile = flag.String("cpuprofile", "", "write cpu profile `file`")
var memprofile = flag.String("memprofile", "", "write memory profile to `file`")

func main() {
    flag.Parse()
    if *cpuprofile != "" {
        f, err := os.Create(*cpuprofile)
        if err != nil {
            log.Fatal("could not create CPU profile: ", err)
        }
        if err := pprof.StartCPUProfile(f); err != nil {
            log.Fatal("could not start CPU profile: ", err)
        }
        defer pprof.StopCPUProfile()
    }
    sum := 0
    chuck := make([]byte, 1024*1024*1024*3)

    for j := 0; j < 5; j++ {
       for i := 0; i <= 1000000; i++ {
           time.Sleep(8 * time.Nanosecond)
           sum += i
       }
    }


    fmt.Println(len(chuck))

    if *memprofile != "" {
        f, err := os.Create(*memprofile)
        if err != nil {
            log.Fatal("could not create memory profile: ", err)
        }
        runtime.GC() // get up-to-date statistics
        if err := pprof.WriteHeapProfile(f); err != nil {
            log.Fatal("could not write memory profile: ", err)
        }
        f.Close()
    }
    fmt.Println(sum)
    fmt.Println(len(chuck))

    //go func() {
    //    for {
    //        log.Println(Add("https://github.com/EDDYCJY"))
    //        time.Sleep(50 * time.Millisecond)
    //    }
    //}()

    http.ListenAndServe("0.0.0.0:6060", nil)

}
2 使用姿势:
- go build pp.go 编译程序
- ./pp -cpuprofile cpu.prof -memprofile mem.prof 运行程序
- go tool pprof pp cpu.prof 分析cpu
- go tool pprof pp mem.prof 分析内存
3 gif web 等命令
输入gif 既可以导出耗时gif,使用help分析更多内容
如下:

4 web server 性能分析
5 火焰图工具
- go get -u github.com/google/pprof
- pprof -http=:8080 cpu.prof
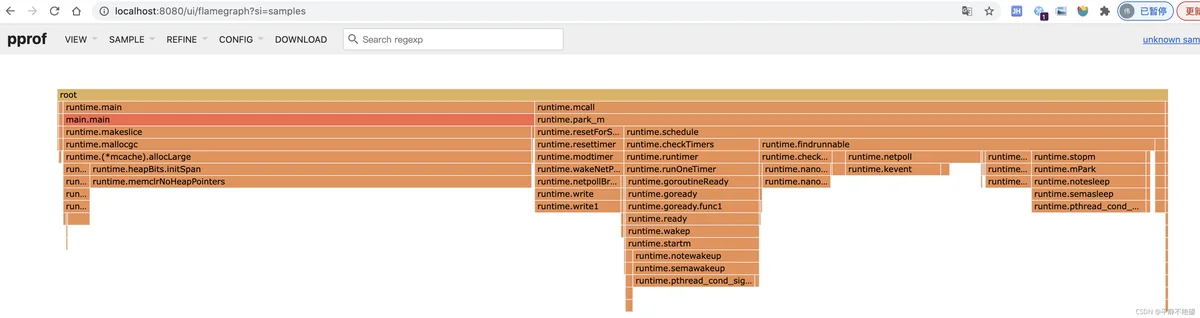
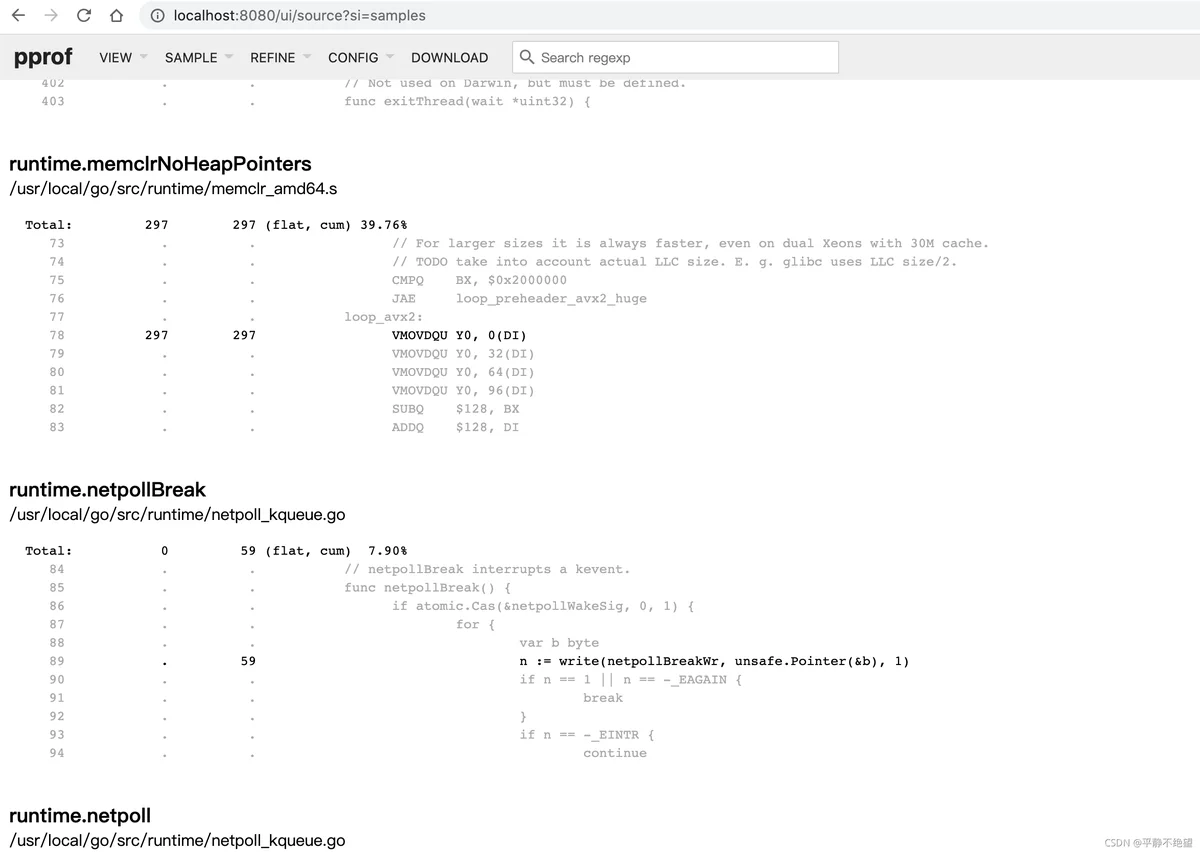
下面图分别选在 Graph 和 Source 展示的图