
golang中的pprof的使用,graphviz
一、关于pprof包
pprofcpu profile, mem profile, block profilenet/http/pprof
runtime/pprof
net/http/pprofruntime/pprofruntime/pprofnet/http/pprof二、使用
方法1、WEB服务器
net/http/pprof_"net/http/pprof"http://localhost:port/debug/pprof/方法2、常驻进程
net/http/pprof_ "net/http/pprof"比如:
go func() {
        log.Println(http.ListenAndServe(":6060", nil))
}()
无论是常驻进程,还是WEb服务器场景,pprof 包都会注册如下路由
func init() {
	http.HandleFunc("/debug/pprof/", Index)
	http.HandleFunc("/debug/pprof/cmdline", Cmdline)
	http.HandleFunc("/debug/pprof/profile", Profile)
	http.HandleFunc("/debug/pprof/symbol", Symbol)
	http.HandleFunc("/debug/pprof/trace", Trace)
}
如果是WEB服务器,我们可以选择监听新的端口,或者使用原有监听;但是如果使用原有监听的话可能无法注册路由,比如你使用的是GIN框架,这个时候可以使用方法2来实现;当然,GIN也有方式来以方法1来开启pprof,这个后面再讲。
http://localhost:6060/debug/pprof/http://localhost:6060/debug/pprof?seconds=30点击每一项可以看到一些原始数据。
由源码可知,基于 http 的 pprof 是在你请求 profile 的时候,它会临时采集一个时间区间(比如30秒)内的对应性能数据;而访问其他指标会立即返回。再采集的时候需要来个压测,这样才会有数据。
这是一种非侵入式的指标采集,几乎不会影响服务的性能。
方法3、普通程序
net/http/pprofruntime/pprofpprof.StartCPUProfilepprof.StopCPUProfilevar cpuprofile = flag.String("cpuprofile", "", "write cpu profile to file")
func main() {
flag.Parse()
if *cpuprofile != "" {
f, err := os.Create(*cpuprofile)
if err != nil {
log.Fatal(err)
}
pprof.StartCPUProfile(f)
defer pprof.StopCPUProfile()
}
…
--cpuprofile./fabonacci --cpuprofile=fabonacci.proffabonacci.profpprof.StartCPUProfilepprof.StopCPUProfilepprof.StartCPUProfilepprof.StopCPUProfilepprof.StopCPUProfile查看内存泄漏或消耗分析,可以使用
fm, err := os.OpenFile("./tmp/mem.out", os.O_RDWR|os.O_CREATE, 0644)
if err != nil {
    log.Fatal(err)
}
pprof.WriteHeapProfile(fm)
fm.Close()
三、go tool pprof 与 图形化
go tool pprof下载安装 graphviz :https://graphviz.org/download/
https://gitlab.com/api/v4/projects/4207231/packages/generic/graphviz-releases/2.47.3/stable_windows_10_cmake_Release_x64_graphviz-install-2.47.3-win64.exe
并且添加到环境变量。
否则会报错:
failed to execute dot. Is Graphviz installed? Error: exec: "dot": executable file not found in %PATH%
pp.gppackage main
import (
"log"
"net/http"
"fmt"
_ "net/http/pprof"
)
func myHandler(w http.ResponseWriter, r *http.Request) {
fmt.Fprintf(w, "Hello World!\n")
}
func main() {
http.HandleFunc("/hello", myHandler)
log.Fatal(http.ListenAndServe(":6060", nil))
}
以查看CPU性能为例,先启动压测
go-wrk -c=400 -t=8 -n=100000 http://localhost:6060/hello
再输入命令
go tool pprof http://localhost:6060/debug/pprof/profile
于是进入一个交互界面
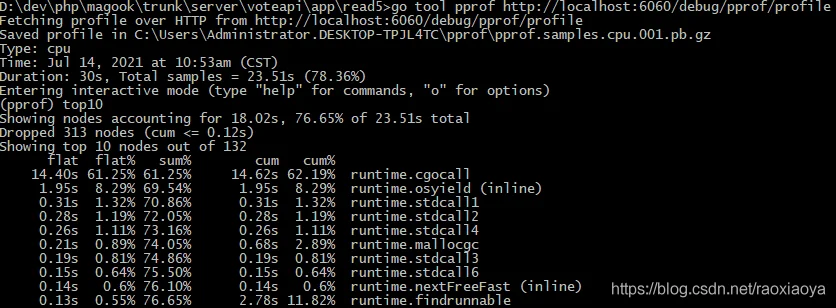
最后一列为函数名称,其他各项内容意义如下:

flat: 当前函数占用CPU的时间
flat%: 当前函数占用CPU百分比
sum%: 当前所有函数累加使用 CPU 的比例
cum: 当前函数以及子函数占用CPU的时间
cum%:  当前函数以及子函数占用CPU的百分比
由提示可知,它是先将下载的原始数据保存在临时文件,然后再来分析。
常用的两个命令
top 10 列出前10
web   调用 graphviz 生成svg图片,然后打开
list  查看具体的函数分析
pdf   命令可以生成可视化的pdf文件
help  命令可以提供所有pprof支持的命令说明
当输入 web 后,会生成svg文件,会打开浏览器。
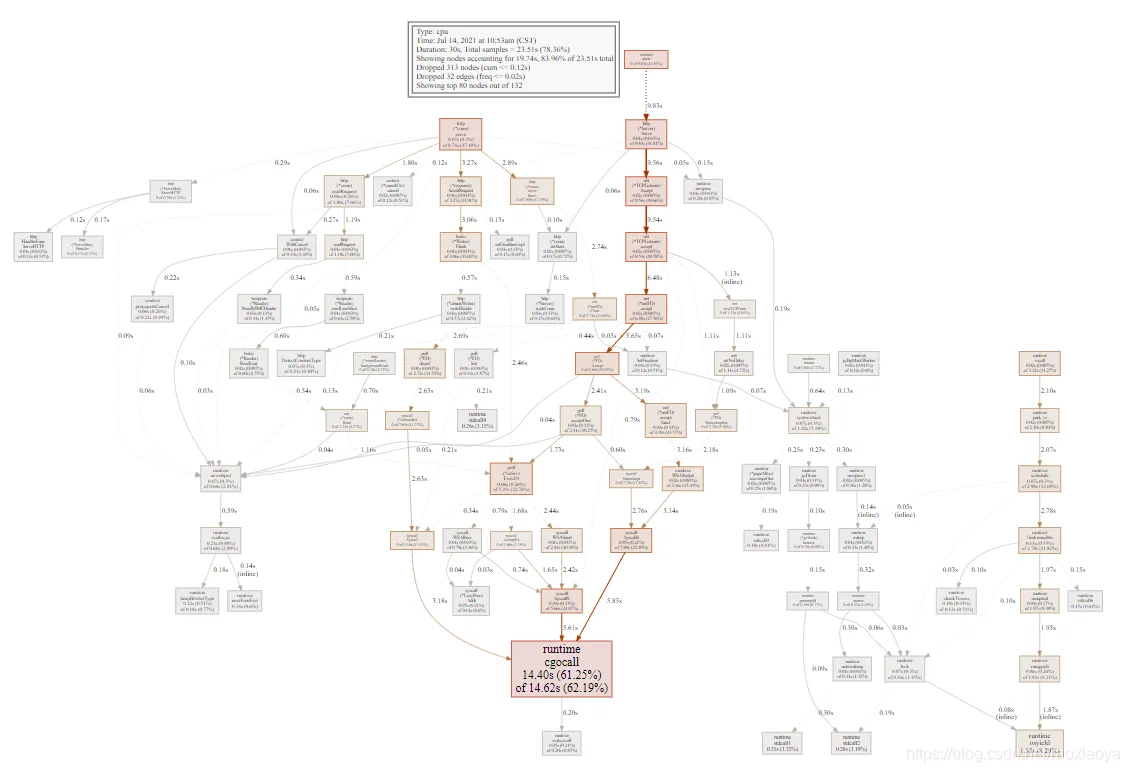
方框里面有百分比,同时方框越大占的CPU时间越多。当然,这样太难分析了,还有更直观的方式。
输入
go tool pprof http://localhost:6060/debug/pprof/profile

Fetching profile over HTTP from http://localhost:6060/debug/pprof/profile
Saved profile in C:\Users\Administrator.DESKTOP-TPJL4TC\pprof\pprof.samples.cpu.001.pb.gz
Type: cpu
Time: Jul 14, 2021 at 10:53am (CST)
Duration: 30s, Total samples = 23.51s (78.36%)
Entering interactive mode (type "help" for commands, "o" for options)
Saved profilego tool pprof -http localhost:3001 C:\Users\Administrator.DESKTOP-TPJL4TC\pprof\pprof.samples.cpu.001.pb.gz
这样就是在浏览器中打开了。
默认是以 greph 的方法展示,首页和上面的图形一样。
可以切换到火焰图 Flame Graph
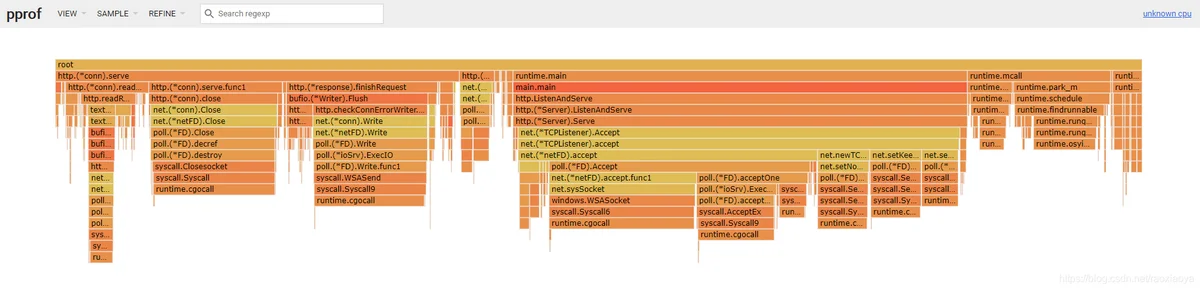
每个方块代表一个函数,它下面一层表示这个函数会调用哪些函数,方块的大小代表了占用 CPU 使用的长短。火焰图的配色并没有特殊的意义,默认的红、黄配色是为了更像火焰而已。
另外,有时候我们通过其他途径得到了 pprof 文件,也可以通过它来分析
go tool pprof 应用程序 应用程序的prof文件go tool pprof prof文件