1. 安装graphviz
1.1 下载 graphviz (windows 环境)
下载完之后安装,安装完成之后将graphviz的安装bin目录加入环境变量中
1.2 测试graphviz是否安装成功
2. 使用pprof
2.1 修改代码
启动程序
2.2 火焰图生成
在命令行下执行
3. Gin框架使用pprof
3.1 安装需要包
进入项目根目录,安装gin使用的pprof包
在项目中使用pprof
example:
3.2 启动程序
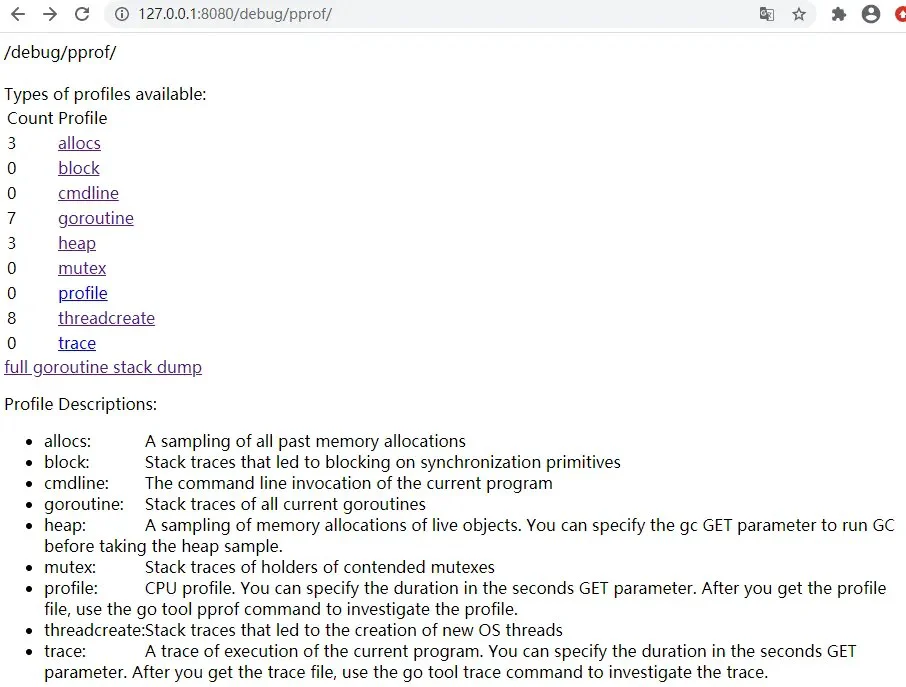
启动程序之后会看到很多自动添加pprof 相关的接口
通过这些接口我们可以进行分析
通过浏览器访问

pprof1.png
3.3 火焰图
在新的命令行窗口
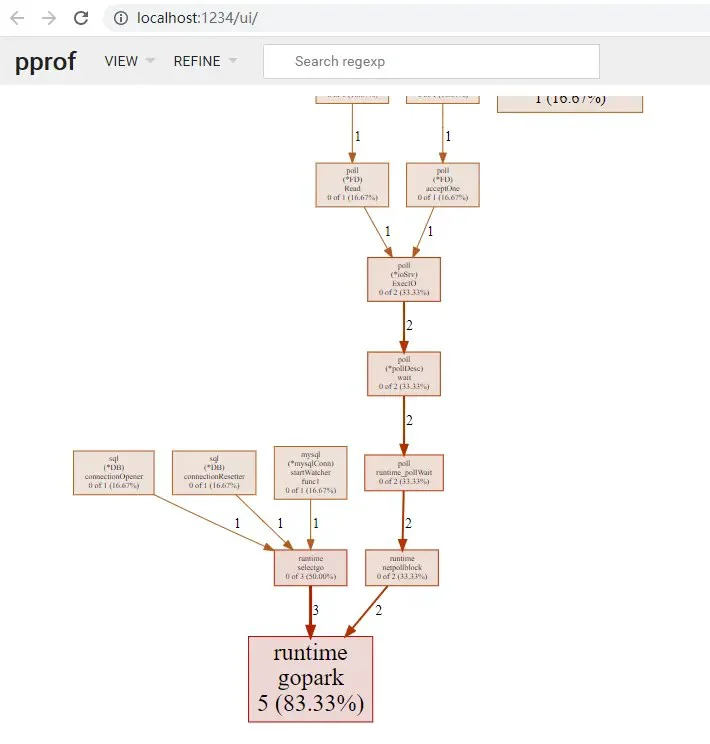
在浏览器中能看到如下的性能分析图:

pprof2.png
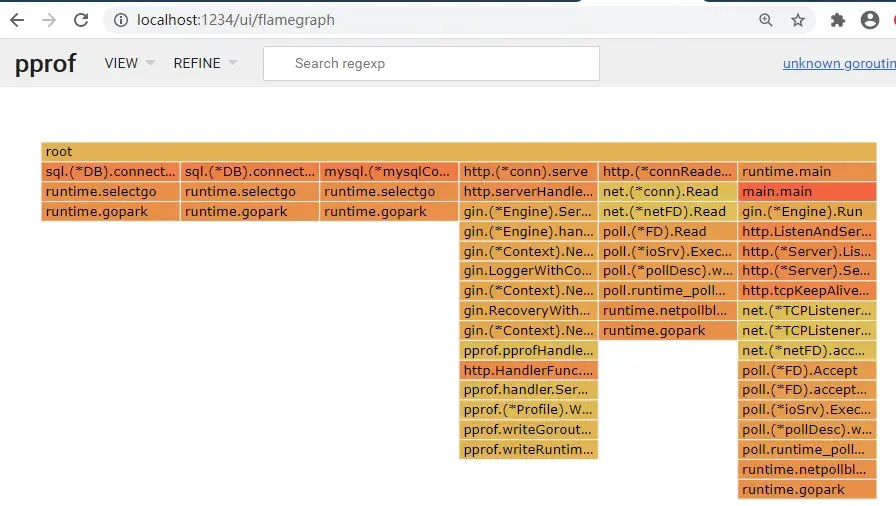
火焰图:

pprof3.png
3.4 pprof命令行
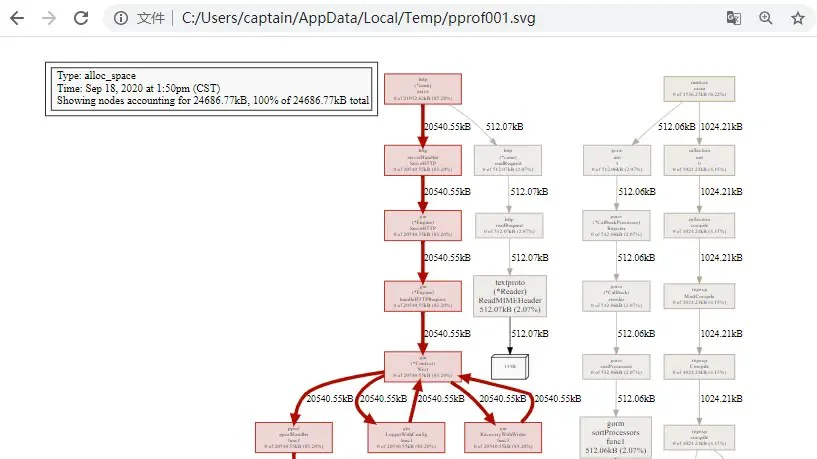
在命令行下可以看到性能数据
使用
go tool pprof + 数据源example :
go tool pprof http://127.0.0.1:8080/debug/pprof/allocs

pprof4.png
参考文档
- [1] gin-contrib/pprof
- [2] pprof
