
Fortio(Φορτίο)最初是Istio的负载测试工具,现在逐渐发展成为自己的项目。
Fortio也被Meshery等公司使用
Fortio以指定的每秒查询(qps)运行,记录执行时间的直方图并计算百分位数(例如p99,即99%的请求的响应时间小于该数字(以秒为单位,国际单位制))。它可以运行一个设定的持续时间、固定数量的调用,或者直到中断(以恒定的目标QPS,或者每个连接/线程的最大速度/负载)。
fortio这个名字来自希腊语φορτίο,意思是负荷/负荷。
Fortio是一个快速、小型(3Mb docker映像,最小依赖性)、可重用、可嵌入的go库以及命令行工具和服务器进程,服务器包括一个简单的web UI和结果的图形化表示(既有单个延迟图,也有多个结果比较最小值、最大值、平均值、qps和百分位图)。
Fortio还包括一组服务器端特性(类似于httpbin),以帮助调试和测试:请求回显(包括报头)、添加具有概率分布的延迟或错误代码、tcp代理、GRPC echo/health以及http等等。。。
Fortio相当成熟,非常稳定,没有已知的主要错误(如果你想贡献的话,还有很多可能的改进!),当发现错误时,它们会很快得到修复,因此经过1年的开发和42个增量版本,我们在2018年6月达到了1.0。
logstatsfhttpInstallation
go get fortio.org/fortiofortio或者使用docker,例如:
docker run -p 8080:8080 -p 8079:8079 fortio/fortio server & # For the server
docker run fortio/fortio load http://www.google.com/ # For a test run
或者从releases assets页面下载一个二进制发行版,例如:
curl -L https://github.com/fortio/fortio/releases/download/v1.6.8/fortio-linux_x64-1.6.8.tgz \
 | sudo tar -C / -xvzpf -
# or the debian package
wget https://github.com/fortio/fortio/releases/download/v1.6.8/fortio_1.6.8-1_amd64.deb
dpkg -i fortio_1.6.8-1_amd64.deb
# or the rpm
rpm -i https://github.com/fortio/fortio/releases/download/v1.6.8/fortio-1.6.8-1.x86_64.rpm
在MacOS上,您还可以使用自制软件安装Fortio:
brew install fortio
fortio server您可以在https://fortio.istio.io/和istio.io/docs/performance-and-scalability/synthetic-benchmarks上获得报告/绘图UI的预览/
命令行参数
loadservergrpcpingcurl-curlredirectreportversionfortio version -shelphttp负载生成的最重要标志:
-qps rate-c connections-t duration-t 30m-n numcalls-r resolution-H "header: value"-a-json filename--data-dirfortio report-a-labels "l1 l2 ..."-content-type-payload-*fortio helpΦορτίο 1.6.8 usage:
fortio command [flags] target
where command is one of: load (load testing), server (starts grpc ping and
http echo/ui/redirect/proxy servers), grpcping (grpc client), report (report
only UI server), redirect (redirect only server), or curl (single URL debug).
where target is a url (http load tests) or host:port (grpc health test).
flags are:
-H header
Additional header(s)
-L Follow redirects (implies -std-client) - do not use for load test
-P value
Proxies to run, e.g -P "localport1 dest_host1:dest_port1" -P "[::1]:0
www.google.com:443" ...
-a Automatically save JSON result with filename based on labels & timestamp
-abort-on int
Http code that if encountered aborts the run. e.g. 503 or -1 for socket
errors.
-allow-initial-errors
Allow and don't abort on initial warmup errors
-base-url string
base URL used as prefix for data/index.tsv generation. (when empty, the
url from the first request is used)
-c int
Number of connections/goroutine/threads (default 4)
-cacert Path
Path to a custom CA certificate file to be used for the GRPC client
TLS, if empty, use https:// prefix for standard internet CAs TLS
-cert Path
Path to the certificate file to be used for GRPC server TLS
-compression
Enable http compression
-config path
Config directory path to watch for changes of dynamic flags (empty for
no watch)
-content-type string
Sets http content type. Setting this value switches the request method
from GET to POST.
-curl
Just fetch the content once
-data-dir Directory
Directory where JSON results are stored/read (default ".")
-echo-debug-path string
http echo server URI for debug, empty turns off that part (more secure)
(default "/debug")
-gomaxprocs int
Setting for runtime.GOMAXPROCS, <1 doesn't change the default
-grpc
Use GRPC (health check by default, add -ping for ping) for load testing
-grpc-max-streams uint
MaxConcurrentStreams for the grpc server. Default (0) is to leave the
option unset.
-grpc-ping-delay duration
grpc ping delay in response
-grpc-port string
grpc server port. Can be in the form of host:port, ip:port or port or
/unix/domain/path or "disabled" to not start the grpc server. (default "8079")
-halfclose
When not keepalive, whether to half close the connection (only for fast
http)
-health
grpc ping client mode: use health instead of ping
-healthservice string
which service string to pass to health check
-http-port string
http echo server port. Can be in the form of host:port, ip:port, port
or /unix/domain/path. (default "8080")
-http1.0
Use http1.0 (instead of http 1.1)
-httpbufferkb kbytes
Size of the buffer (max data size) for the optimized http client in
kbytes (default 128)
-httpccch
Check for Connection: Close Header
-https-insecure
Long form of the -k flag
-jitter
set to true to de-synchronize parallel clients' requests
-json path
Json output to provided file path or '-' for stdout (empty = no json
output, unless -a is used)
-k Do not verify certs in https connections
-keepalive
Keep connection alive (only for fast http 1.1) (default true)
-key Path
Path to the key file used for GRPC server TLS
-labels string
Additional config data/labels to add to the resulting JSON, defaults to
target URL and hostname
-logcaller
Logs filename and line number of callers to log (default true)
-loglevel value
loglevel, one of [Debug Verbose Info Warning Error Critical Fatal]
(default Info)
-logprefix string
Prefix to log lines before logged messages (default "> ")
-maxpayloadsizekb int
MaxPayloadSize is the maximum size of payload to be generated by the
EchoHandler size= argument. In Kbytes. (default 256)
-n int
Run for exactly this number of calls instead of duration. Default (0)
is to use duration (-t). Default is 1 when used as grpc ping count.
-p string
List of pXX to calculate (default "50,75,90,99,99.9")
-payload string
Payload string to send along
-payload-file path
File path to be use as payload (POST for http), replaces -payload when
set.
-payload-size int
Additional random payload size, replaces -payload when set > 0, must be
smaller than -maxpayloadsizekb. Setting this switches http to POST.
-ping
grpc load test: use ping instead of health
-profile file
write .cpu and .mem profiles to file
-qps float
Queries Per Seconds or 0 for no wait/max qps (default 8)
-quiet
Quiet mode: sets the loglevel to Error and reduces the output.
-r float
Resolution of the histogram lowest buckets in seconds (default 0.001)
-redirect-port string
Redirect all incoming traffic to https URL (need ingress to work
properly). Can be in the form of host:port, ip:port, port or "disabled" to
disable the feature. (default "8081")
-resolve string
Resolve CN of cert to this IP, so that we can call https://cn directly
-s int
Number of streams per grpc connection (default 1)
-static-dir path
Absolute path to the dir containing the static files dir
-stdclient
Use the slower net/http standard client (works for TLS)
-sync string
index.tsv or s3/gcs bucket xml URL to fetch at startup for server modes.
-sync-interval duration
Refresh the url every given interval (default, no refresh)
-t duration
How long to run the test or 0 to run until ^C (default 5s)
-timeout duration
Connection and read timeout value (for http) (default 15s)
-ui-path string
http server URI for UI, empty turns off that part (more secure)
(default "/fortio/")
-unix-socket path
Unix domain socket path to use for physical connection
-user user:password
User credentials for basic authentication (for http). Input data format
should be user:password
另请参阅有关fortio标志的FAQ条目以获得最佳结果
示例使用和输出
启动内部服务器
$ fortio server &
Fortio 1.6.8 grpc 'ping' server listening on [::]:8079
Fortio 1.6.8 https redirector server listening on [::]:8081
Fortio 1.6.8 echo server listening on [::]:8080
UI started - visit:
http://localhost:8080/fortio/
(or any host/ip reachable on this server)
14:57:12 I fortio_main.go:217> All fortio 1.6.8 release go1.10.3 servers started!
更改端口/绑定地址
-http-port$ fortio server -http-port 10.10.10.10:8088
UI starting - visit:
http://10.10.10.10:8088/fortio/
Https redirector running on :8081
Fortio 1.6.8 grpc ping server listening on port :8079
Fortio 1.6.8 echo server listening on port 10.10.10.10:8088
Unix域套接字
您可以对任何服务器/客户端使用unix域套接字:
$ fortio server --http-port /tmp/fortio-uds-http &
Fortio 1.6.8 grpc 'ping' server listening on [::]:8079
Fortio 1.6.8 https redirector server listening on [::]:8081
Fortio 1.6.8 echo server listening on /tmp/fortio-uds-http
UI started - visit:
fortio curl -unix-socket=/tmp/fortio-uds-http http://localhost/fortio/
14:58:45 I fortio_main.go:217> All fortio 1.6.8 unknown go1.10.3 servers started!
$ fortio curl -unix-socket=/tmp/fortio-uds-http http://foo.bar/debug
15:00:48 I http_client.go:428> Using unix domain socket /tmp/fortio-uds-http instead of foo.bar http
HTTP/1.1 200 OK
Content-Type: text/plain; charset=UTF-8
Date: Wed, 08 Aug 2018 22:00:48 GMT
Content-Length: 231

Φορτίο version 1.6.8 unknown go1.10.3 echo debug server up for 2m3.4s on ldemailly-macbookpro - request from

GET /debug HTTP/1.1

headers:

Host: foo.bar
User-Agent: fortio.org/fortio-1.6.8

body:
GRPC
简单的grpc ping
$ fortio grpcping localhost
02:29:27 I pingsrv.go:116> Ping RTT 305334 (avg of 342970, 293515, 279517 ns) clock skew -2137
Clock skew histogram usec : count 1 avg -2.137 +/- 0 min -2.137 max -2.137 sum -2.137
# range, mid point, percentile, count
>= -4 < -2 , -3 , 100.00, 1
# target 50% -2.137
RTT histogram usec : count 3 avg 305.334 +/- 27.22 min 279.517 max 342.97 sum 916.002
# range, mid point, percentile, count
>= 250 < 300 , 275 , 66.67, 2
>= 300 < 350 , 325 , 100.00, 1
# target 50% 294.879
更改grpc的目标端口
grpcping-grpc-port:portgrpcping$ fortio grpcping 10.10.10.100:8078 # Connects to gRPC server 10.10.10.100 listening on port 8078
02:29:27 I pingsrv.go:116> Ping RTT 305334 (avg of 342970, 293515, 279517 ns) clock skew -2137
Clock skew histogram usec : count 1 avg -2.137 +/- 0 min -2.137 max -2.137 sum -2.137
# range, mid point, percentile, count
>= -4 < -2 , -3 , 100.00, 1
# target 50% -2.137
RTT histogram usec : count 3 avg 305.334 +/- 27.22 min 279.517 max 342.97 sum 916.002
# range, mid point, percentile, count
>= 250 < 300 , 275 , 66.67, 2
>= 300 < 350 , 325 , 100.00, 1
# target 50% 294.879
grpcping-cert-key/path/to/fortio/server.crt/path/to/fortio/server.key$ fortio server -cert /path/to/fortio/server.crt -key /path/to/fortio/server.key
UI starting - visit:
http://localhost:8080/fortio/
Https redirector running on :8081
Fortio 1.6.8 grpc ping server listening on port :8079
Fortio 1.6.8 echo server listening on port localhost:8080
Using server certificate /path/to/fortio/server.crt to construct TLS credentials
Using server key /path/to/fortio/server.key to construct TLS credentials
grpcping-cacert/path/to/fortio/ca.crtlocalhost/path/to/fortio/server.crt$ fortio grpcping -cacert /path/to/fortio/ca.crt localhost
Using server certificate /path/to/fortio/ca.crt to construct TLS credentials
16:00:10 I pingsrv.go:129> Ping RTT 501452 (avg of 595441, 537088, 371828 ns) clock skew 31094
Clock skew histogram usec : count 1 avg 31.094 +/- 0 min 31.094 max 31.094 sum 31.094
# range, mid point, percentile, count
>= 31.094 <= 31.094 , 31.094 , 100.00, 1
# target 50% 31.094
RTT histogram usec : count 3 avg 501.45233 +/- 94.7 min 371.828 max 595.441 sum 1504.357
# range, mid point, percentile, count
>= 371.828 <= 400 , 385.914 , 33.33, 1
> 500 <= 595.441 , 547.721 , 100.00, 2
# target 50% 523.86
GRPC到标准https服务
grpcpinghttps://$ fortio grpcping https://fortio.istio.io
11:07:55 I grpcrunner.go:275> stripping https scheme. grpc destination: fortio.istio.io. grpc port: 443
Clock skew histogram usec : count 1 avg 12329.795 +/- 0 min 12329.795 max 12329.795 sum 12329.795
# range, mid point, percentile, count
>= 12329.8 <= 12329.8 , 12329.8 , 100.00, 1
# target 50% 12329.8
简单负荷试验
负载(低默认qps/线程)测试:
$ fortio load http://www.google.com
Fortio 1.6.8 running at 8 queries per second, 8->8 procs, for 5s: http://www.google.com
19:10:33 I httprunner.go:84> Starting http test for http://www.google.com with 4 threads at 8.0 qps
Starting at 8 qps with 4 thread(s) [gomax 8] for 5s : 10 calls each (total 40)
19:10:39 I periodic.go:314> T002 ended after 5.056753279s : 10 calls. qps=1.9775534712220633
19:10:39 I periodic.go:314> T001 ended after 5.058085991s : 10 calls. qps=1.9770324224999916
19:10:39 I periodic.go:314> T000 ended after 5.058796046s : 10 calls. qps=1.9767549252963101
19:10:39 I periodic.go:314> T003 ended after 5.059557593s : 10 calls. qps=1.9764573910247019
Ended after 5.059691387s : 40 calls. qps=7.9056
Sleep times : count 36 avg 0.49175757 +/- 0.007217 min 0.463508712 max 0.502087879 sum 17.7032725
Aggregated Function Time : count 40 avg 0.060587641 +/- 0.006564 min 0.052549016 max 0.089893269 sum 2.42350566
# range, mid point, percentile, count
>= 0.052549 < 0.06 , 0.0562745 , 47.50, 19
>= 0.06 < 0.07 , 0.065 , 92.50, 18
>= 0.07 < 0.08 , 0.075 , 97.50, 2
>= 0.08 <= 0.0898933 , 0.0849466 , 100.00, 1
# target 50% 0.0605556
# target 75% 0.0661111
# target 99% 0.085936
# target 99.9% 0.0894975
Code 200 : 40
Response Header Sizes : count 40 avg 690.475 +/- 15.77 min 592 max 693 sum 27619
Response Body/Total Sizes : count 40 avg 12565.2 +/- 301.9 min 12319 max 13665 sum 502608
All done 40 calls (plus 4 warmup) 60.588 ms avg, 7.9 qps
GRPC负荷试验
-s-c$ fortio load -a -grpc -ping -grpc-ping-delay 0.25s -payload "01234567890" -c 2 -s 4 https://fortio-stage.istio.io
Fortio 1.6.8 running at 8 queries per second, 8->8 procs, for 5s: https://fortio-stage.istio.io
16:32:56 I grpcrunner.go:139> Starting GRPC Ping Delay=250ms PayloadLength=11 test for https://fortio-stage.istio.io with 4*2 threads at 8.0 qps
16:32:56 I grpcrunner.go:261> stripping https scheme. grpc destination: fortio-stage.istio.io. grpc port: 443
16:32:57 I grpcrunner.go:261> stripping https scheme. grpc destination: fortio-stage.istio.io. grpc port: 443
Starting at 8 qps with 8 thread(s) [gomax 8] for 5s : 5 calls each (total 40)
16:33:04 I periodic.go:533> T005 ended after 5.283227589s : 5 calls. qps=0.9463911814835126
[...]
Ended after 5.28514474s : 40 calls. qps=7.5684
Sleep times : count 32 avg 0.97034752 +/- 0.002338 min 0.967323561 max 0.974838789 sum 31.0511206
Aggregated Function Time : count 40 avg 0.27731944 +/- 0.001606 min 0.2741372 max 0.280604967 sum 11.0927778
# range, mid point, percentile, count
>= 0.274137 <= 0.280605 , 0.277371 , 100.00, 40
# target 50% 0.277288
# target 75% 0.278947
# target 90% 0.279942
# target 99% 0.280539
# target 99.9% 0.280598
Ping SERVING : 40
All done 40 calls (plus 2 warmup) 277.319 ms avg, 7.6 qps
Successfully wrote 1210 bytes of Json data to 2018-04-03-163258_fortio_stage_istio_io_ldemailly_macbookpro.json
保存的JSON是
{
  "RunType": "GRPC Ping Delay=250ms PayloadLength=11",
  "Labels": "fortio-stage.istio.io , ldemailly-macbookpro",
  "StartTime": "2018-04-03T16:32:58.895472681-07:00",
  "RequestedQPS": "8",
  "RequestedDuration": "5s",
  "ActualQPS": 7.568383075162479,
  "ActualDuration": 5285144740,
  "NumThreads": 8,
  "Version": "0.9.0",
  "DurationHistogram": {
    "Count": 40,
    "Min": 0.2741372,
    "Max": 0.280604967,
    "Sum": 11.092777797,
    "Avg": 0.277319444925,
    "StdDev": 0.0016060870789948905,
    "Data": [
      {
        "Start": 0.2741372,
        "End": 0.280604967,
        "Percent": 100,
        "Count": 40
      }
    ],
    "Percentiles": [
      {
        "Percentile": 50,
        "Value": 0.2772881634102564
      },
      {
        "Percentile": 75,
        "Value": 0.27894656520512817
      },
      {
        "Percentile": 90,
        "Value": 0.2799416062820513
      },
      {
        "Percentile": 99,
        "Value": 0.28053863092820513
      },
      {
        "Percentile": 99.9,
        "Value": 0.2805983333928205
      }
    ]
  },
  "Exactly": 0,
  "RetCodes": {
    "1": 40
  },
  "Destination": "https://fortio-stage.istio.io",
  "Streams": 4,
  "Ping": true
}
-cert-keyfortio server -cert /etc/ssl/certs/server.crt -key /etc/ssl/certs/server.key
-cacertloadfortio load -cacert /etc/ssl/certs/ca.crt -grpc localhost:8079
类卷曲(单请求)模式
$ fortio load -curl -H Foo:Bar http://localhost:8080/debug
14:26:26 I http.go:133> Setting regular extra header Foo: Bar
HTTP/1.1 200 OK
Content-Type: text/plain; charset=UTF-8
Date: Mon, 08 Jan 2018 22:26:26 GMT
Content-Length: 230

Φορτίο version 1.6.8 echo debug server up for 39s on ldemailly-macbookpro - request from [::1]:65055

GET /debug HTTP/1.1

headers:

Host: localhost:8080
User-Agent: fortio.org/fortio-1.6.8
Foo: Bar

body:
仅报告用户界面
-synchttp://:8080/data/index.tsv$ fortio report -sync-interval 15m -sync http://storage.googleapis.com:443/fortio-data?prefix=fortio.istio.io/
Browse only UI starting - visit:
http://localhost:8080/
Https redirector running on :8081
使用TCP代理服务器功能
示例:打开2个额外的侦听端口,并将8888和8889(ipv6)上接收到的所有请求转发到8080(常规http服务器)
$ fortio server -P "8888 [::1]:8080" -P "[::1]:8889 [::1]:8080"
Fortio 1.6.8 grpc 'ping' server listening on [::]:8079
Fortio 1.6.8 https redirector server listening on [::]:8081
Fortio 1.6.8 echo server listening on [::]:8080
Data directory is /home/dl
UI started - visit:
http://localhost:8080/fortio/
(or any host/ip reachable on this server)
Fortio 1.6.8 proxy for [::1]:8080 server listening on [::]:8888
Fortio 1.6.8 proxy for [::1]:8080 server listening on [::1]:8889
服务器URL和功能
servercurl -d abcdef http://localhost:8080/abcdefdelay=150us:10,2ms:5,0.5s:1status=404:10,503:5,429:1size=1024:10,512:5close=true&header=Foo:Bar&header=X:Y/debug/fortio//fortio/data/index.tsvindex.tsvreport/还有GRPC health和ping服务器,以及http->https重定向器。
Implementation details
Fortio是用Go语言编写的,在stats.go中包含一个可伸缩的半日志柱状图,periodic.go中包含一个周期性的运行引擎,专门用于http和grpc。http/包包括一个非常高性能的专用http1.1客户端。你可能会发现fortio的记录器也很有用。
fortio serverfortio curlMore examples
您可以在控制台上获取数据,例如,使用5k qps:(包括通话中的特使和混音器)
$ time fortio load -qps 5000 -t 60s -c 8 -r 0.0001 -H "Host: perf-cluster" http://benchmark-2:9090/echo
2017/07/09 02:31:05 Will be setting special Host header to perf-cluster
Fortio running at 5000 queries per second for 1m0s: http://benchmark-2:9090/echo
Starting at 5000 qps with 8 thread(s) [gomax 4] for 1m0s : 37500 calls each (total 300000)
2017/07/09 02:32:05 T004 ended after 1m0.000907812s : 37500 calls. qps=624.9905437680746
2017/07/09 02:32:05 T000 ended after 1m0.000922222s : 37500 calls. qps=624.9903936684861
2017/07/09 02:32:05 T005 ended after 1m0.00094454s : 37500 calls. qps=624.9901611965524
2017/07/09 02:32:05 T006 ended after 1m0.000944816s : 37500 calls. qps=624.9901583216429
2017/07/09 02:32:05 T001 ended after 1m0.00102094s : 37500 calls. qps=624.9893653892883
2017/07/09 02:32:05 T007 ended after 1m0.001096292s : 37500 calls. qps=624.9885805003184
2017/07/09 02:32:05 T003 ended after 1m0.001045342s : 37500 calls. qps=624.9891112105419
2017/07/09 02:32:05 T002 ended after 1m0.001044416s : 37500 calls. qps=624.9891208560392
Ended after 1m0.00112695s : 300000 calls. qps=4999.9
Aggregated Sleep Time : count 299992 avg 8.8889218e-05 +/- 0.002326 min -0.03490402 max 0.001006041 sum 26.6660543
# range, mid point, percentile, count
< 0 , 0 , 8.58, 25726
>= 0 < 0.001 , 0.0005 , 100.00, 274265
>= 0.001 < 0.002 , 0.0015 , 100.00, 1
# target 50% 0.000453102
WARNING 8.58% of sleep were falling behind
Aggregated Function Time : count 300000 avg 0.00094608764 +/- 0.0007901 min 0.000510522 max 0.029267604 sum 283.826292
# range, mid point, percentile, count
>= 0.0005 < 0.0006 , 0.00055 , 0.15, 456
>= 0.0006 < 0.0007 , 0.00065 , 3.25, 9295
>= 0.0007 < 0.0008 , 0.00075 , 24.23, 62926
>= 0.0008 < 0.0009 , 0.00085 , 62.73, 115519
>= 0.0009 < 0.001 , 0.00095 , 85.68, 68854
>= 0.001 < 0.0011 , 0.00105 , 93.11, 22293
>= 0.0011 < 0.0012 , 0.00115 , 95.38, 6792
>= 0.0012 < 0.0014 , 0.0013 , 97.18, 5404
>= 0.0014 < 0.0016 , 0.0015 , 97.94, 2275
>= 0.0016 < 0.0018 , 0.0017 , 98.34, 1198
>= 0.0018 < 0.002 , 0.0019 , 98.60, 775
>= 0.002 < 0.0025 , 0.00225 , 98.98, 1161
>= 0.0025 < 0.003 , 0.00275 , 99.21, 671
>= 0.003 < 0.0035 , 0.00325 , 99.36, 449
>= 0.0035 < 0.004 , 0.00375 , 99.47, 351
>= 0.004 < 0.0045 , 0.00425 , 99.57, 290
>= 0.0045 < 0.005 , 0.00475 , 99.66, 280
>= 0.005 < 0.006 , 0.0055 , 99.79, 380
>= 0.006 < 0.007 , 0.0065 , 99.82, 92
>= 0.007 < 0.008 , 0.0075 , 99.83, 15
>= 0.008 < 0.009 , 0.0085 , 99.83, 5
>= 0.009 < 0.01 , 0.0095 , 99.83, 1
>= 0.01 < 0.012 , 0.011 , 99.83, 8
>= 0.012 < 0.014 , 0.013 , 99.84, 35
>= 0.014 < 0.016 , 0.015 , 99.92, 231
>= 0.016 < 0.018 , 0.017 , 99.94, 65
>= 0.018 < 0.02 , 0.019 , 99.95, 26
>= 0.02 < 0.025 , 0.0225 , 100.00, 139
>= 0.025 < 0.03 , 0.0275 , 100.00, 14
# target 50% 0.000866935
# target 75% 0.000953452
# target 99% 0.00253875
# target 99.9% 0.0155152
Code 200 : 300000
Response Body Sizes : count 300000 avg 0 +/- 0 min 0 max 0 sum 0
-json result.jsonWeb/Graphical UI
或图形化(通过http://localhost:8080/fortio/web用户界面):
Simple form/UI:
响应延迟250us、503的0.5%和429个的1.5%的示例请求模拟了http错误。
Run result:
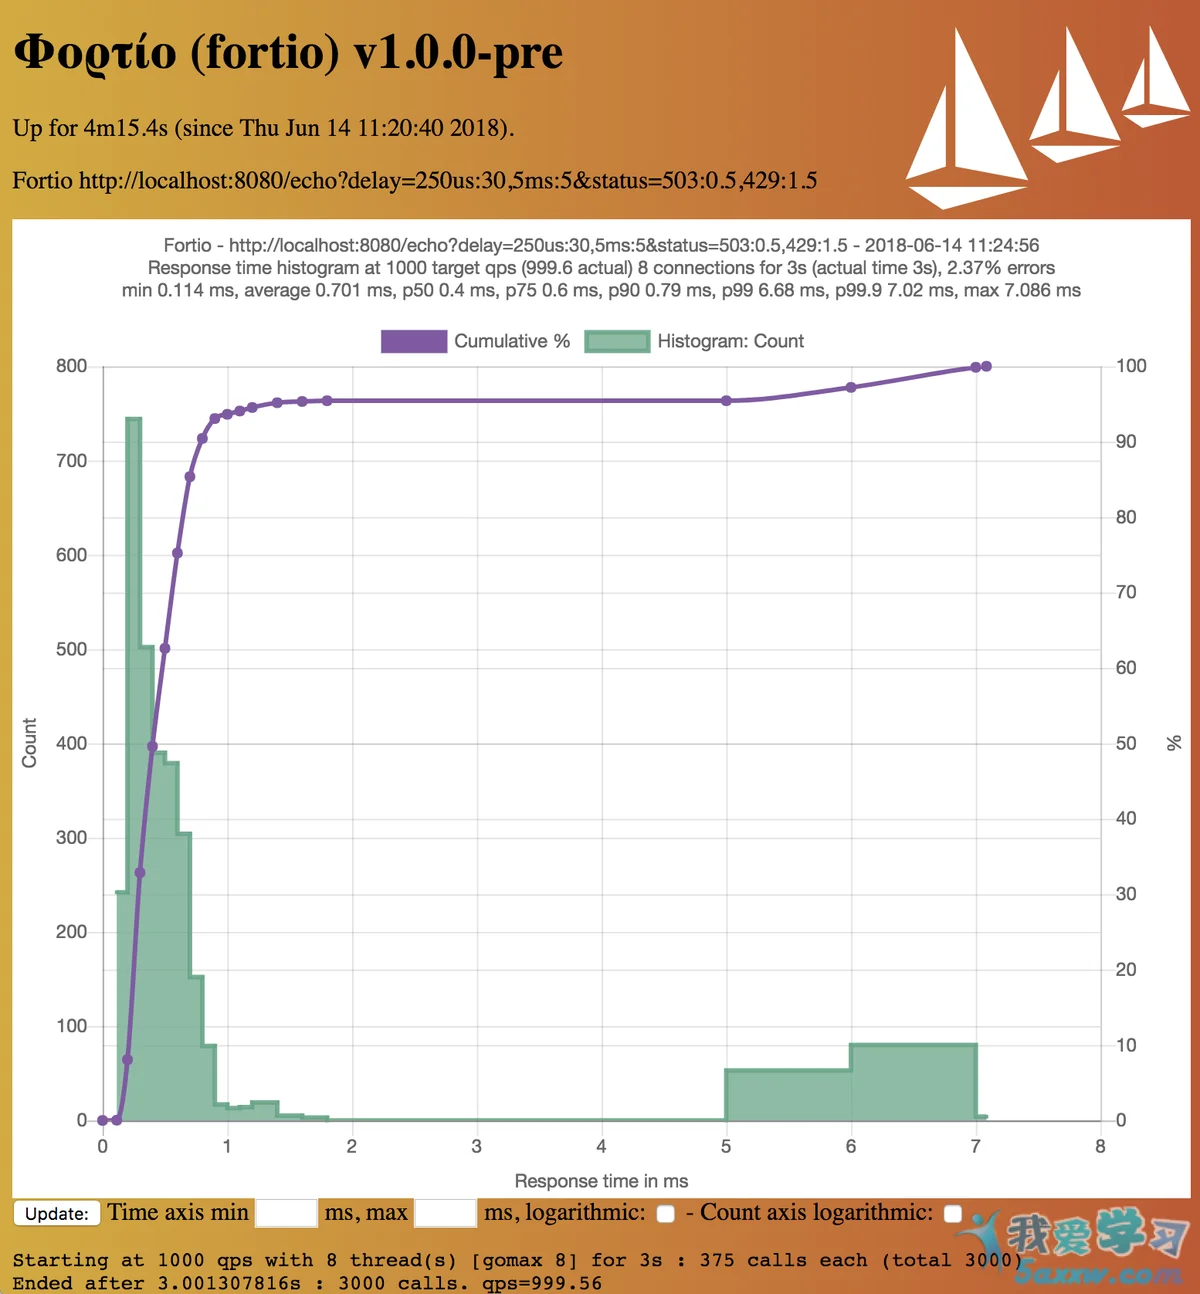
Code 200 : 2929 (97.6 %)
Code 429 : 56 (1.9 %)
Code 503 : 15 (0.5 %)
istio.io/docs/concepts/performance-and-scalability/#synthetic-end-to-end-benchmarks上有更新的/实时的示例
Contributing
无论是通过问题、文档、错误修复还是新功能的贡献都是最受欢迎的!
另请参阅常见问题解答中的“为Istio提供帮助”和“开始向Fortio捐款”。
make pullgo get mvdan.cc/gofumptgofumpt -s -w *.gomake test
make lint
make release-test
修改Javascript时,请检查标准:
standard --fix ui/static/js/fortio_chart.js
See also
fortiowrkhttpbinDisclaimer
这不是官方支持的Google产品。