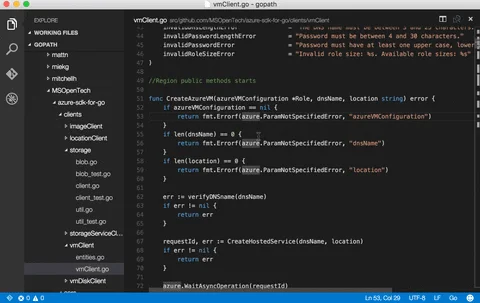
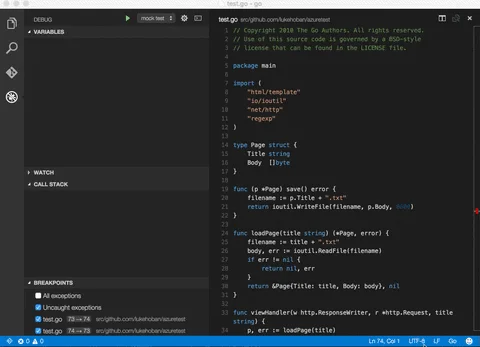
Visual Studio Code开发工具对Go语言开发的支持,特性包括:
- Colorization
- Completion Lists (usinggocode)
- Snippets
- Quick Info (usinggodef)
- Goto Definition (usinggodef)
- Find References (usinggo-find-references)
- File outline (usinggo-outline)
- Rename (usinggorename)
- Build-on-save (usinggo buildandgo test)
- Format (usinggoreturnsorgoimportsorgofmt)
- [partially implemented] Debugging (usingdelve)
IDE Features

Debugger

Using
First, you will need to install Visual Studio Code0.10. In the command palette (cmd-shift-p) selectInstall Extensionand chooseGo.
In a terminal window with the GOPATH environment variable set to the GOPATH you want to work on, launchcode. Open you GOPATH folder or any subfolder you want to work on, then open a.gofile to start editing.
Note: It is strongly encouraged to turnAuto Saveon in Visual Studio Code (File -> Auto Save) when using this extension. Many of the Go tools work only on saved files, and error reporting will be more interactive withAuto Saveturned on.
Options
The following Visual Studio Code settings are available for the Go extension. These can be set in user preferences (cmd+,) or workspace settings (.vscode/settings.json).
{
    "go.buildOnSave": true,
    "go.lintOnSave": true,
    "go.vetOnSave": true,
    "go.formatTool": "goreturns",
    "go.gopath": "/Users/lukeh/go"
}
Optional: Debugging
To use the debugger, you must currently manually installdelve. See the Installation Instructions for full details. This is not yet supported on Windows, and on OS X it requires creating a self-signed cert to sign thedlvbinary.
Once this is installed, go to the Code debug viewlet and select the configuration gear, placing the following in your launch.json:
{
    "version": "0.1.0",
    "configurations": [
        {
            "name": "Launch main.go",
            "type": "go",
            "request": "launch",
            "program": "main.go",
            "stopOnEntry": false,
            "env": {},
            "args": [],
            "cwd": "."
        }
    ]
}
Building and Debugging the Extension
You can set up a development environment for debugging the extension during extension development.
First make sure you do not have the extension installed in~/.vscode/extensions. Then clone the repo somewhere else on your machine, runnpm installand open a development instance of Code.
rm -rf ~/.vscode/extensions/lukehoban.Go
cd ~
git clone https://github.com/Microsoft/vscode-go
cd vscode-go
npm install
code .
You can now go to the Debug viewlet and selectLaunch Extensionthen hit run (F5).
In the[Extension Development Host]instance, open your GOPATH folder.
You can now hit breakpoints and step through the extension.
If you make edits in the extension.tsfiles, just reload (cmd-r) the[Extension Development Host]instance of Code to load in the new extension code. The debugging instance will automatically reattach.
To debug the debugger, see the debugAdapter readme.
Tools
The extension uses the following tools, installed in the current GOPATH. If any tools are missing, the extension will offer to install them for you.
- gocode:go get -u -v github.com/nsf/gocode
- godef:go get -u -v github.com/rogpeppe/godef
- golint:go get -u -v github.com/golang/lint/golint
- go-find-references:go get -u -v github.com/lukehoban/go-find-references
- goreturns:go get -u -v sourcegraph.com/sqs/goreturns
- gorename:go get -u -v golang.org/x/tools/cmd/gorename
And for debugging:
