基准测试主要是通过测试CPU和内存的效率问题,来评估被测试代码的性能,并将该数据作为基准来比较每次调优后的性能是否有所改善,进而找到更好的解决方案。
(一)编写基准测试
首先我们先看一个基准测试的例子。是不是很像我们经常说的单元测试
func BenchmarkSprintf(b *testing.B){
	num:=10
	b.ResetTimer()
	for i:=0;i<b.N;i++{
		fmt.Sprintf("%d",num)
	}
}
以下是go语言中基准测试需要关注的几个前提条件:
b.StopTimer()b.StartTimer()-bench-bench-bench=.➜ go test -bench=. -run=none
BenchmarkSprintf-12 13088973 78.8 ns/op
PASS
ok github.com/simonhgao/testsrv 1.536s
(二)基准测试的运行准备:
常用flag
-bench regexp-benchmem-cpu=n-count n-run regexp-timeout t-v-cpuprofile=$FILE$FILE-memprofile=$FILE$FILE-memprofilerate=N1/N-blockprofile=$FILE$FILEgo test-run=none-run=^$go test -bench=. -run=^$
有些时候在benchmark之前需要做一些准备工作,并且,我们不希望这些准备工作纳入到计时里面,我们可以使用 b.ResetTimer(),代表重置计时为0,以调用时的时刻作为重新计时的开始。
BenchmarkSprintf-12-121308897378.8 ns/op如果想让测试运行的时间更长,可以通过-benchtime指定,比如3秒。
➜ go test -bench=. -run=none -benchtime=3s
BenchmarkSprintf-12     41707867                78.7 ns/op
PASS
ok      github.com/simonhgao/testsrv       3.735s
可以发现,我们加长了测试时间,测试的次数变多了,但是最终的性能结果:每次执行的时间,并没有太大变化。一般来说这个值最好不要超过3秒,意义不大。
性能对比(benchmem):
上面那个基准测试的例子,其实是一个int类型转为string类型的例子,标准库里还有几种方法,我们看下哪种性能更加.
func BenchmarkSprintf(b *testing.B){
	num:=10
	b.ResetTimer()
	for i:=0;i<b.N;i++{
		fmt.Sprintf("%d",num)
	}
}

func BenchmarkFormat(b *testing.B){
	num:=int64(10)
	b.ResetTimer()
	for i:=0;i<b.N;i++{
		strconv.FormatInt(num,10)
	}
}

func BenchmarkItoa(b *testing.B){
	num:=10
	b.ResetTimer()
	for i:=0;i<b.N;i++{
		strconv.Itoa(num)
	}
}
➜  go test -bench=. -benchmem -run=none
pkg: git.code.oa.com/simonhgao/testsrv
BenchmarkSprintf-12     13767098                78.1 ns/op            16 B/op          2 allocs/op
BenchmarkFormat-12      310182928                3.85 ns/op            0 B/op          0 allocs/op
BenchmarkItoa-12        284967086                4.15 ns/op            0 B/op          0 allocs/op
PASS
ok      github.com/simonhgao/testsrv       4.723s
-benchmem在代码开发中,对于我们要求性能的地方,编写基准测试非常重要,这有助于我们开发出性能更好的代码。不过性能、可用性、复用性等也要有一个相对的取舍,不能为了追求性能而过度优化。
(三)结合 pprof进行更形象化的分析:
pprof 性能监控
package bench
import "testing"
func Fib(n int) int {
    if n < 2 {
      return n
    }
    return Fib(n-1) + Fib(n-2)
}
func BenchmarkFib10(b *testing.B) {
    // run the Fib function b.N times
    for n := 0; n < b.N; n++ {
      Fib(10)
    }
}
可以同时看内存和CPU分析
go test -bench=. -benchmem -memprofile memprofile.out -cpuprofile profile.out
然后就可以用输出的文件使用pprof(进入pprof环境)
➜ go tool pprof profile.out
Type: cpu
Time: May 19, 2021 at 3:26pm (CST)
Duration: 1.56s, Total samples = 1.33s (85.34%)
Entering interactive mode (type "help" for commands, "o" for options)
(pprof) top
Showing nodes accounting for 1.33s, 100% of 1.33s total
Showing top 10 nodes out of 18
      flat  flat%   sum%        cum   cum%
     1.26s 94.74% 94.74%      1.27s 95.49%  github.com/simonhgao/testsrv.Fib
     0.05s  3.76% 98.50%      0.05s  3.76%  runtime.nanotime1
     0.01s  0.75% 99.25%      0.01s  0.75%  runtime.newstack
     0.01s  0.75%   100%      0.01s  0.75%  runtime.pthread_cond_signal
         0     0%   100%      1.27s 95.49%  github.com/simonhgao/testsrv.BenchmarkFib10
         0     0%   100%      0.01s  0.75%  runtime.findrunnable
         0     0%   100%      0.01s  0.75%  runtime.mcall
         0     0%   100%      0.05s  3.76%  runtime.mstart
         0     0%   100%      0.05s  3.76%  runtime.mstart1
         0     0%   100%      0.05s  3.76%  runtime.nanotime (inline)
然后你也可以用list命令检查函数需要的时间
(pprof) list Fib
     1.26s      1.98s (flat, cum) 148.87% of Total
         .          .      1:package main
         .          .      2:
         .          .      3:import "testing"
         .          .      4:
     440ms      450ms      5:func Fib(n int) int {
     150ms      150ms      6:   if n < 2 {
     110ms      110ms      7:           return n
         .          .      8:   }
     560ms      1.27s      9:   return Fib(n-1) + Fib(n-2)
         .          .     10:}
         .          .     11:func BenchmarkFib10(b *testing.B) {
         .          .     12:   // run the Fib function b.N times
         .          .     13:   for n := 0; n < b.N; n++ {
         .          .     14:           Fib(10)
图像分析
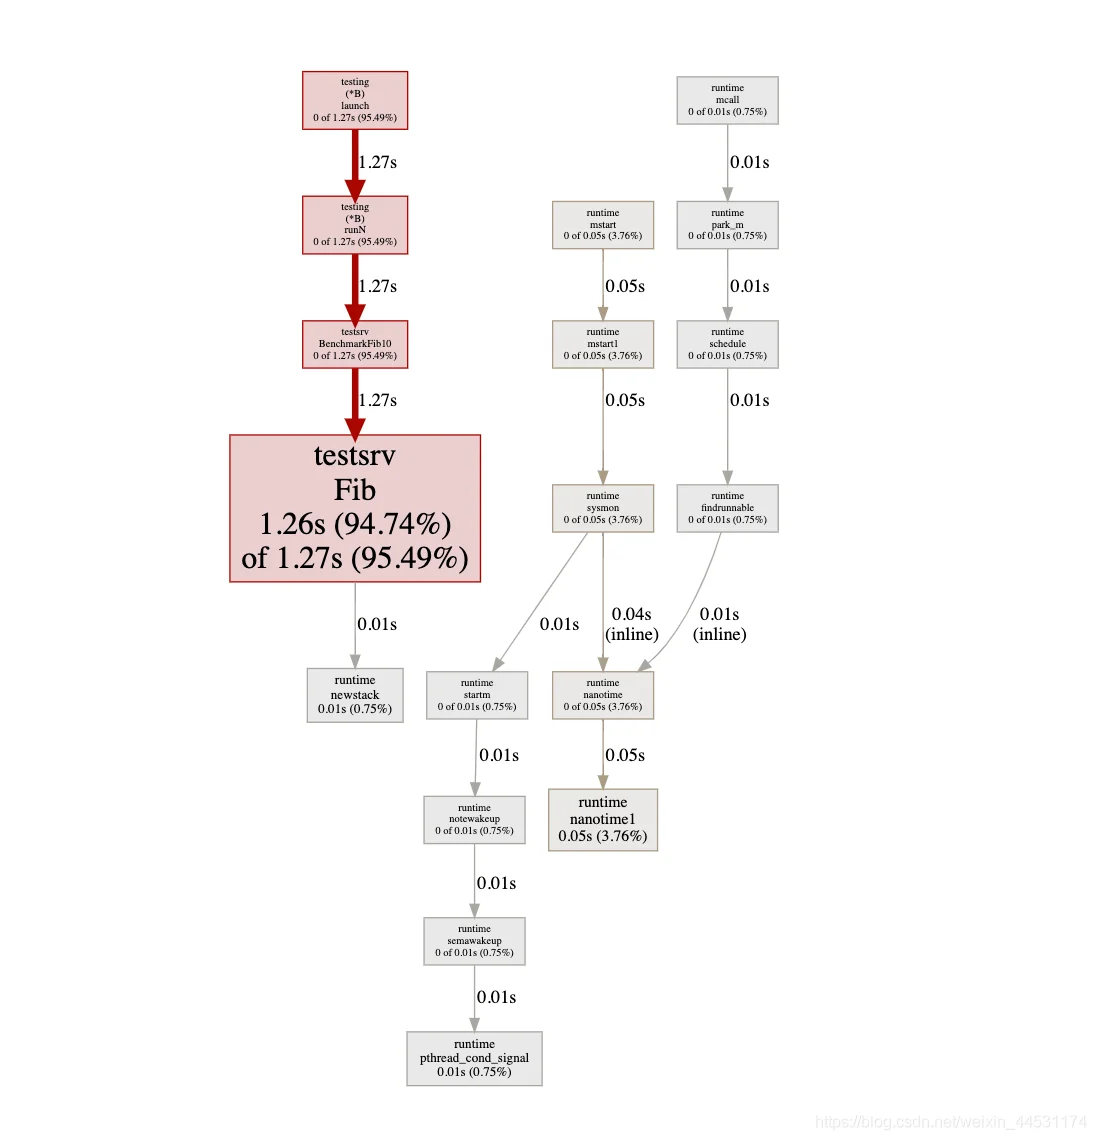
从 Go 1.11 开始, 火焰图等多种分析图被集成进入 Go 官方的 pprof 库.
# This will listen on :8081 and open a browser.
# Change :8081 to a port of your choice.
$ go tool pprof -http=":8081" [binary] [profile]
我们可以通过上述的方法来快速的生成一个本地网址,然后查看这些分析图
go tool pprof -http=":8081" profile.out我们可以获得:
➜  go tool pprof -http=":8081" profile.out
Serving web UI on http://localhost:8081

如果遇到报错:Failed to execute dot. Is Graphviz installed? Error: exec: “dot”: executable file not found in %PATH% (第一次一定会碰到)
是你电脑没有安装graphviz导致的:
windows可以进入gvedit官网下载地址 下载稳定版
mac 安装比较简单, 执行下边的指令安装好后就可以使用web进行展现了
brew install graphviz
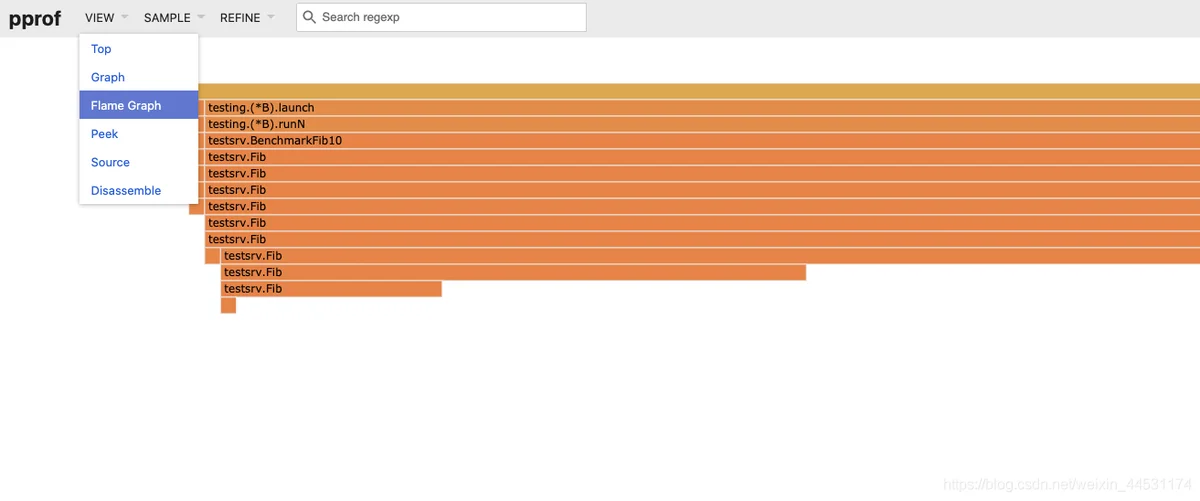
火焰图:
火焰图(Flame Graph)是 Bredan Gregg 创建的一种性能分析图表,因为它的样子近似火焰而得名。
火焰图 svg 文件可以通过浏览器打开,它对于调用图的最优点是它是动态的:可以通过点击每个方块来 zoom in 分析它上面的内容。
火焰图的调用顺序从下到上,每个方块代表一个函数,它上面一层表示这个函数会调用哪些函数,方块的大小代表了占用 CPU 使用的长短。火焰图的配色并没有特殊的意义,默认的红、黄配色是为了更像火焰而已。
火焰图我们可以通过上边生成的网址http://localhost:8081下拉菜单选择 Flame Graph就可以了。

当然pprof还有更多的使用方法,详细的可看:tutorial
(四)总结:
_test.goBenchmarkb *testing.Bb.ResetTimer()b.StopTimer()b.StartTimer()go test -bench .-bench-cpu-benchtime-count-benchmem-memprofile -cpuprofilego tool pprof -http=":8081" [binary] [profile]Reference:
https://segmentfault.com/a/1190000016354758
https://segmentfault.com/a/1190000007951944
