
如果cpu或内存占用明显,使用pprof则能很快定位到问题。否则最好结合多个时间段的数据对比进行查看。
1、golang代码中引入pprof
import(
    _ "net/http/pprof"
)
Demo全部代码如下:
package main

import (
	"fmt"
	"log"
	"net/http"
	_ "net/http/pprof"
)

func main() {
	http.HandleFunc("/", indexHandler)
	http.HandleFunc("/hello", helloHandler)
	log.Fatal(http.ListenAndServe(":9999", nil))
}

// handler echoes r.URL.Path
func indexHandler(w http.ResponseWriter, req *http.Request) {
	for i:= 0;i<100;i++ {
		fmt.Fprintf(w, "URL.Path = %q\n", `package main

import (
	"fmt"
	"log"
	"net/http"
	_ "net/http/pprof"
)

func main() {
	http.HandleFunc("/", indexHandler)
	http.HandleFunc("/hello", helloHandler)
	log.Fatal(http.ListenAndServe(":9999", nil))
}

// handler echoes r.URL.Path
func indexHandler(w http.ResponseWriter, req *http.Request) {
	fmt.Fprintf(w, "URL.Path = %q\n", req.URL.Path)
}

// handler echoes r.URL.Header
func helloHandler(w http.ResponseWriter, req *http.Request) {
	for k, v := range req.Header {
		fmt.Fprintf(w, "Header[%q] = %q\n", k, v)
	}
}`)
	}
}

// handler echoes r.URL.Header
func helloHandler(w http.ResponseWriter, req *http.Request) {
	for k, v := range req.Header {
		fmt.Fprintf(w, "Header[%q] = %q\n", k, v)
	}
}
go run main.go拉起服务
3、浏览器访问
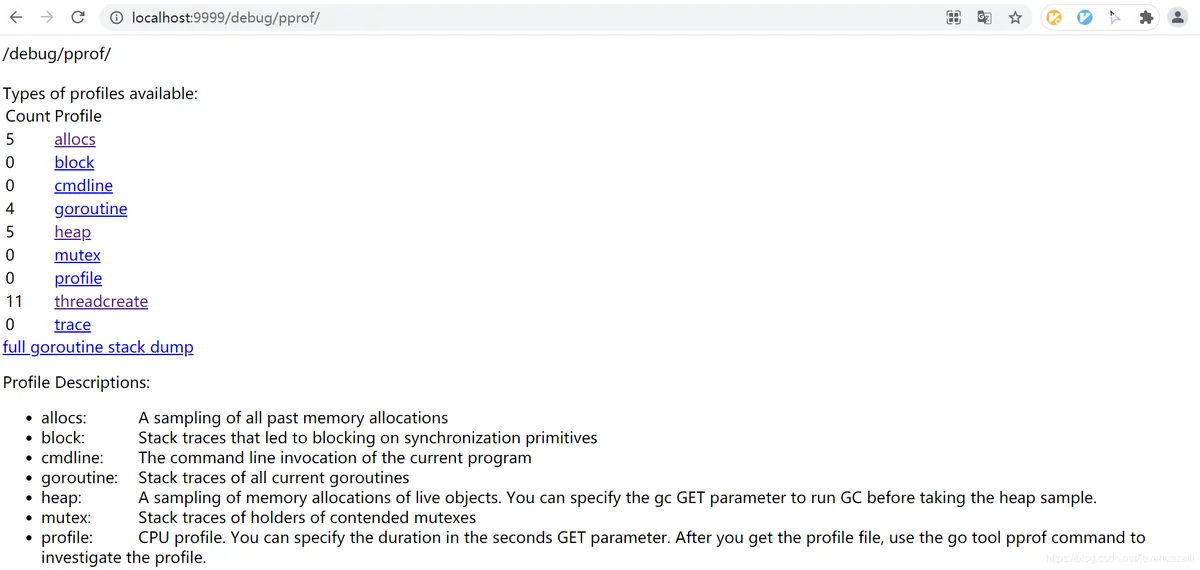
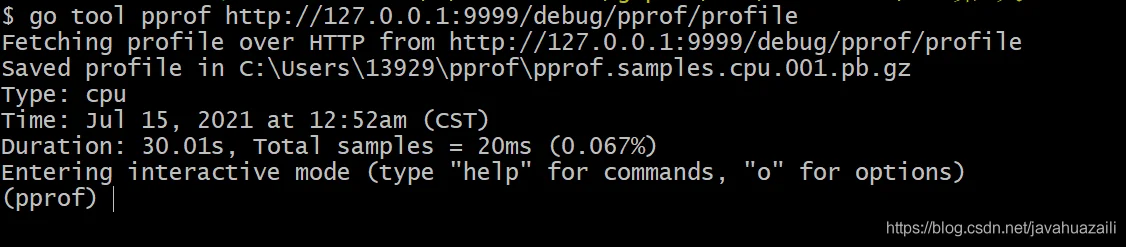
4、使用pprof
go tool pprof http://127.0.0.1:9999/debug/pprof/profile如下图:
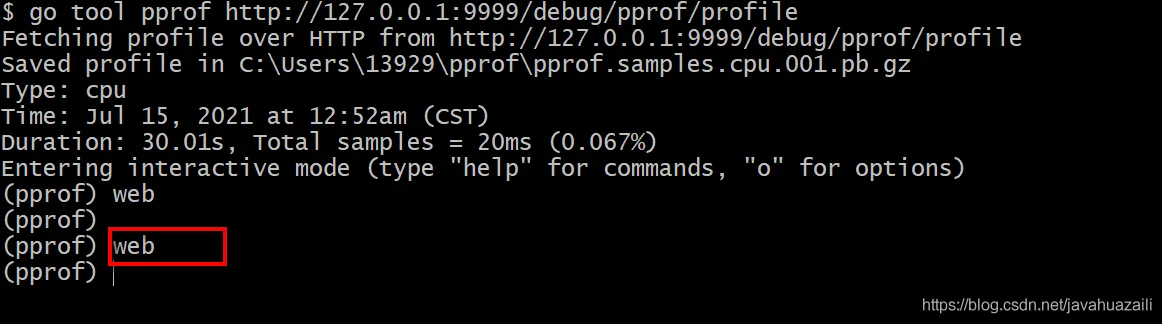
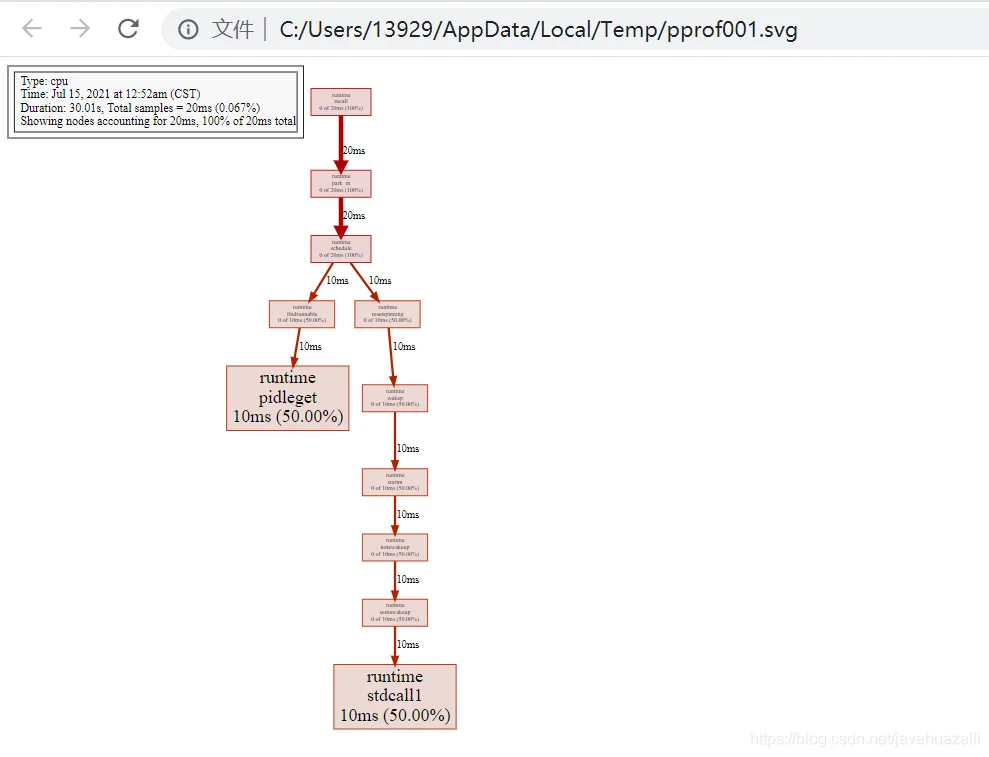
web.svg如下图 :
此时浏览器会自动访问到svg图片:
6、或者直接执行
go tool pprof -alloc_space -cum -svg http://192.168.1.17:9999/debug/pprof/heap > heap.svg
或者
go tool pprof -http 0.0.0.0:8899 http://192.168.1.11:32220/debug/pprof/allocs此时会在本地拉起一个8899的服务,用来实时中转展示服务上pprof上的对应指标
通过左上角的菜单栏可以选择看“火焰图’”等等
7、下载数据使用pprof查看(适合不能直接访问到pprof端口的情况,比如容器内)
curl http://xxxxxx/debug/pprof/heap > base.heap
curl http://xxxxxx/debug/pprof/heap > current.heap
go tool pprof -http 0.0.0.0:9987 -alloc_space --base base.heap current.heap
