
Go语言的工具链对开发者非常友好,内置了很多性能调优、测试的工具,比如CPU分析器pprof、Uber开源的用于生成火焰图的go-torch、流量拷贝工具goreplay等,这些工具极大的提高了开发者效率,下面就笔者的使用分别进行总结。
pprof
Go的强大之处是它已经在语言层面集成了profile采样工具,允许程序在运行时使用它们,使用Go的profiler能获取以下样本信息:
1.cpu profile:报告程序的CPU使用情况,按照一定频率去采集应用程序在CPU和寄存器上的数据。
/debug/pprof/profile:访问这个链接会自动进行 CPU profiling,持续 30s,并生成一个文件供下载
2.memory profile(heap profile):报告程序内存的使用情况。
/debug/pprof/heap: Memory Profiling 的路径,访问这个链接会得到一个内存 Profiling 结果的文件。
3.block profile:报告goroutines不在运行状态的情况,可以用来分析和查找死锁等性能瓶颈。
/debug/pprof/block:block Profiling 的路径。
4.goroutine profile:报告goroutines的使用情况,有哪些goroutine,它们的调用关系是怎样的。
/debug/pprof/goroutines:运行的 goroutines 列表,以及调用关系
Go中在net/http/pprof 和runtime/pprof 两个地方提供性能监测的包,但其实net/http/pprof中只是使用runtime/pprof包进行封装了一下,并在http端口上暴露出来。
常用命令
*top
top $N 用于显示前N个占用CPU最高的函数, top \$N –cum表示前N个累积占用CPU最高的函数。(累积,是指采样的栈里面存在这个函数,也就是它的整个子调用链的占有时间都累加起来 )
*list
list $function 可以展示这个function中每一行占用的情况。
*web
使用web可以打开一个可视化的图。
注意: ubuntu通过sudo apt-get install -y graphviz安装可视化工具。
如何使用
*web服务器
对于web服务器,可以直接引入_ "net/http/pprof" ,然后在浏览器中使用http://local:port/debug/pprof 即可直接查看当前web服务器的CPU占用情况和内存使用情况。具体使用请查看参考资料。
*服务程序
对于服务程序,也可选择使用net/http/pprof包,首先引入net/http/pprof包,然后开启一个单独的goroutine来开启端口监听。
//例子
go func() {
log.Println(http.ListenAndServe("localhost:8080", http.DefaultServeMux))
}
*应用程序
如果你的程序只是一个应用程序,比如计算fabonacci数列,对于这种情况,你需要使用runtime/pprof 。以下实例代码展示cpu和内存的profile:
var cpuprofile = flag.String("cpuprofile", "", "write cpu profile to `file`")
var memprofile = flag.String("memprofile", "", "write memory profile to `file`")
func main() {
  flag.Parse()
  if *cpuprofile != "" {
      f, err := os.Create(*cpuprofile)
      if err != nil {
          log.Fatal("could not create CPU profile: ", err)
      }
      if err := pprof.StartCPUProfile(f); err != nil {
          log.Fatal("could not start CPU profile: ", err)
      }
      defer pprof.StopCPUProfile()
  }
  // ... rest of the program ...
  if *memprofile != "" {
      f, err := os.Create(*memprofile)
      if err != nil {
          log.Fatal("could not create memory profile: ", err)
      }
      runtime.GC() // get up-to-date statistics
      if err := pprof.WriteHeapProfile(f); err != nil {
          log.Fatal("could not write memory profile: ", err)
      }
      f.Close()
  }
}
注意:
- 程序运行时需加入–cpuprofile参数,例如./fabonacci --cpuprofile=fabnacci.prof,此时程序运行的信息会记录到.prof后缀的文件中。
- 使用go tool pprof fabnacci.prof (应用程序的prof文件),进入pprof提示界面,输入web命令可以查看在/tmp目录下生产的svg文件。(需要安装graphviz)
- 获取的 Profiling 数据是动态的,要想获得有效的数据,请保证应用处于较大的负载(比如正在生成中运行的服务,或者通过其他工具模拟访问压力)。否则如果应用处于空闲状态,得到的结果可能没有任何意义。
go-torch
go-torch是Uber公司开源的一款针对Golang程序的火焰图生成工具,能收集 stack traces,并把它们整理成火焰图,直观地程序给开发人员。go-torch是基于使用BrendanGregg创建的火焰图工具生成直观的图像,很方便地分析Go的各个方法所占用的CPU的时间。
如何安装
准备环境
  git clone https://github.com/brendangregg/FlameGraph.git
  cp flamegraph.pl /usr/local/bin
注意: 在终端输入flamegraph.pl -h检验是否安装FlameGraph成功
安装go-torch
go get -v github.com/uber/go-torch
常用命令
go-torch工具的使用非常简单,没有任何参数时,它会尝试从http://localhost:8080/debug/pprof/profile获取profiling数据,常用的三个参数如下:
- -u –url:要访问的URL,这里只是主机和端口部分(eg:http://localhost:9090)
- -s –suffix:pprof profile的路径,默认为/debug/pprof/profile
- –seconds:要执行profiling的时间长度,默认为30s
如何使用及火焰图介绍
样例——go-torch -u http://localhost:9090 -t 30
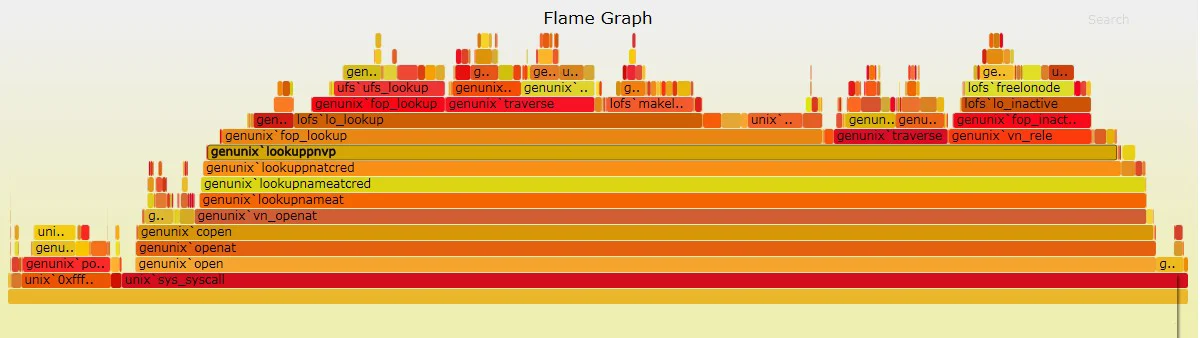
- y轴表示调用栈,每一层都是一个函数。调用栈越深,火焰就越高,顶部就是正在执行的函数,下方都是它的父函数。
- x 轴表示抽样数,如果一个函数在 x 轴占据的宽度越宽,就表示它被抽到的次数多,即执行的时间长。注意,x 轴不代表时间,而是所有的调用栈合并后,按字母顺序排列的。
- 火焰图就是看顶层的哪个函数占据的宽度最大。只要有”平顶”(plateaus),就表示该函数可能存在性能问题。
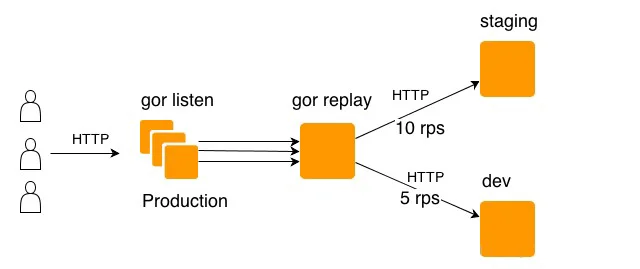
goreplay
gorepaly是一个开源工具,抓取生产环境流量,并使用真实流量持续测试系统。它使用raw-socket抓取系统流量,并根据指定的url,将流量进行转发。
如何安装
可以到 https://github.com/buger/gor/releases 下载特定版本及平台的二进制包,并放在可执行目录下。 (当前支持的系统有 Windows, Linux x64 and Mac OS)
linux 64位安装示例
wget https://github.com/buger/goreplay/releases/download/v0.16.1/gor_0.16.1_x64.tar.gz
tar -xvf gor_0.16.1_x64.tar.gz
cp goreplay /usr/local/bin
如何使用
抓取数据包
sudo goreplay --input-raw :8080 --output-stdout
将抓到的包打印到终端,进行查看,原理类似于tcpdump。
重放数据包
sudo goreplay --input-raw :8080 --output-http="http://localhost:8111"
使用–out-stdout参数替换–out-http,并加上要转发的url,就可以将抓到的包转发到目的地。
保存以及重放
保存数据包到requests.gor文件
sudo gorelay --input-raw :8080 --output-file=requests.gor
重放requests.gor数据包
sudo --input-file requests.gor --output-http="http://localhost:8111"
可以使用–output-file和–input-file来保存、重放数据包
常用命令
简单的HTTP流量复制
$ gor --input-raw :80 --output-http "http://staging.com"
HTTP流量复制频率控制(获取每秒超过10个请求)
$ gor --input-tcp :28020 --output-http "http://staging.com|10"
HTTP流量复制缩小
$ gor --input-raw :80 --output-tcp "replay.local:28020|10%"
HTTP流量记录到本地文件
$ gor --input-raw :80 --output-file requests.gor
HTTP流量回放和压测
$ gor --input-file "requests.gor|200%" --output-http "staging.com"
HTTP流量过滤复制
$ gor --input-raw :8080 --output-http staging.com --output-http-url-regexp ^www.
自定义一些流量复制的参数
$ gor --input-raw :80 --output-http 192.168.2.6:8000 --http-allow-method POST --http-set-header 'User-Agent: Gor' -output-http-workers=1 -http-allow-url test.php
将流量复制两份到不同的测试服务
$ gor --input-tcp :28020 --output-http "http://staging.com" --output-http "http://dev.com"
将流量像负载均衡一样分配到不同的服务器
$ gor --input-tcp :28020 --output-http "http://staging.com" --output-http "http://dev.com" --split-output true
程序员编程交流QQ群:805358732
如果你想用Python开辟副业赚钱,但不熟悉爬虫与反爬虫技术,没有接单途径,也缺乏兼职经验
关注下方微信公众号:Python编程学习圈,获取价值999元全套Python入门到进阶的学习资料以及教程,还有Python技术交流群一起交流学习哦。