
Go语言的工具链对开发者非常友好,内置了很多性能调优、测试的工具,比如CPU分析器pprof、Uber开源的用于生成火焰图的go-torch、流量拷贝工具goreplay等,这些工具极大的提高了开发者效率,下面就笔者的使用分别进行总结。
pprof
Go的强大之处是它已经在语言层面集成了profile采样工具,允许程序在运行时使用它们,使用Go的profiler能获取以下样本信息:
/debug/pprof/profile/debug/pprof/heap/debug/pprof/block/debug/pprof/goroutinesnet/http/pprofruntime/pprof常用命令
sudo apt-get install -y graphviz如何使用
//例子
go func() {
log.Println(http.ListenAndServe("localhost:8080", http.DefaultServeMux))
}
var cpuprofile = flag.String("cpuprofile", "", "write cpu profile to `file`")
var memprofile = flag.String("memprofile", "", "write memory profile to `file`")
func main() {
flag.Parse()
if *cpuprofile != "" {
f, err := os.Create(*cpuprofile)
if err != nil {
log.Fatal("could not create CPU profile: ", err)
}
if err := pprof.StartCPUProfile(f); err != nil {
log.Fatal("could not start CPU profile: ", err)
}
defer pprof.StopCPUProfile()
}
// ... rest of the program ...
if *memprofile != "" {
f, err := os.Create(*memprofile)
if err != nil {
log.Fatal("could not create memory profile: ", err)
}
runtime.GC() // get up-to-date statistics
if err := pprof.WriteHeapProfile(f); err != nil {
log.Fatal("could not write memory profile: ", err)
}
f.Close()
}
}参考资料
go-torch
go-torch是Uber公司开源的一款针对Golang程序的火焰图生成工具,能收集 stack traces,并把它们整理成火焰图,直观地程序给开发人员。go-torch是基于使用BrendanGregg创建的火焰图工具生成直观的图像,很方便地分析Go的各个方法所占用的CPU的时间。
如何安装
准备环境
  git clone https://github.com/brendangregg/FlameGraph.git
cp flamegraph.pl /usr/local/bin注意: 在终端输入flamegraph.pl -h检验是否安装FlameGraph成功
安装go-torch
go get -v github.com/uber/go-torch常用命令
http://localhost:8080/debug/pprof/profile/debug/pprof/profile如何使用及火焰图介绍
go-torch -u http://localhost:9090 -t 30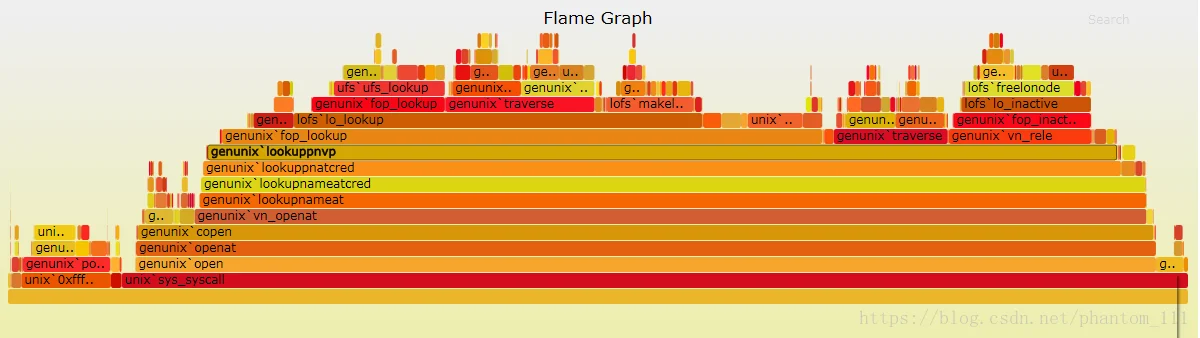
- y轴表示调用栈,每一层都是一个函数。调用栈越深,火焰就越高,顶部就是正在执行的函数,下方都是它的父函数。
- x 轴表示抽样数,如果一个函数在 x 轴占据的宽度越宽,就表示它被抽到的次数多,即执行的时间长。注意,x 轴不代表时间,而是所有的调用栈合并后,按字母顺序排列的。
- 火焰图就是看顶层的哪个函数占据的宽度最大。只要有”平顶”(plateaus),就表示该函数可能存在性能问题。
参考资料
goreplay
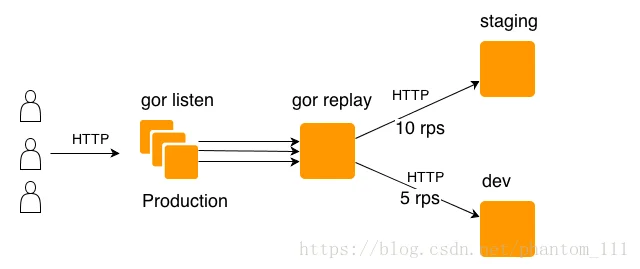
gorepaly是一个开源工具,抓取生产环境流量,并使用真实流量持续测试系统。它使用raw-socket抓取系统流量,并根据指定的url,将流量进行转发。
如何安装
可以到 https://github.com/buger/gor/releases 下载特定版本及平台的二进制包,并放在可执行目录下。 (当前支持的系统有 Windows, Linux x64 and Mac OS)
wget https://github.com/buger/goreplay/releases/download/v0.16.1/gor_0.16.1_x64.tar.gz
tar -xvf gor_0.16.1_x64.tar.gz
cp goreplay /usr/local/bin
如何使用
抓取数据包
sudo goreplay --input-raw :8080 --output-stdout重放数据包
sudo goreplay --input-raw :8080 --output-http="http://localhost:8111"保存以及重放
sudo gorelay --input-raw :8080 --output-file=requests.gorsudo --input-file requests.gor --output-http="http://localhost:8111"常用命令
$ gor --input-raw :80 --output-http "http://staging.com"$ gor --input-tcp :28020 --output-http "http://staging.com|10"$ gor --input-raw :80 --output-tcp "replay.local:28020|10%"$ gor --input-raw :80 --output-file requests.gor$ gor --input-file "requests.gor|200%" --output-http "staging.com"$ gor --input-raw :8080 --output-http staging.com --output-http-url-regexp ^www.$ gor --input-raw :80 --output-http 192.168.2.6:8000 --http-allow-method POST --http-set-header 'User-Agent: Gor' -output-http-workers=1 -http-allow-url test.php$ gor --input-tcp :28020 --output-http "http://staging.com" --output-http "http://dev.com"$ gor --input-tcp :28020 --output-http "http://staging.com" --output-http "http://dev.com" --split-output true参考资料
笔者大致对golang描述的工具链,进行总结,如有错误,欢迎指出。后面将会结合上述工具,以一个Demo为例,进行分析。