
在 Go 中有许许多多的分析工具,在之前我有写过一篇 《Golang 大杀器之性能剖析 PProf》 来介绍 PProf,如果有小伙伴感兴趣可以去我博客看看。
go tool trace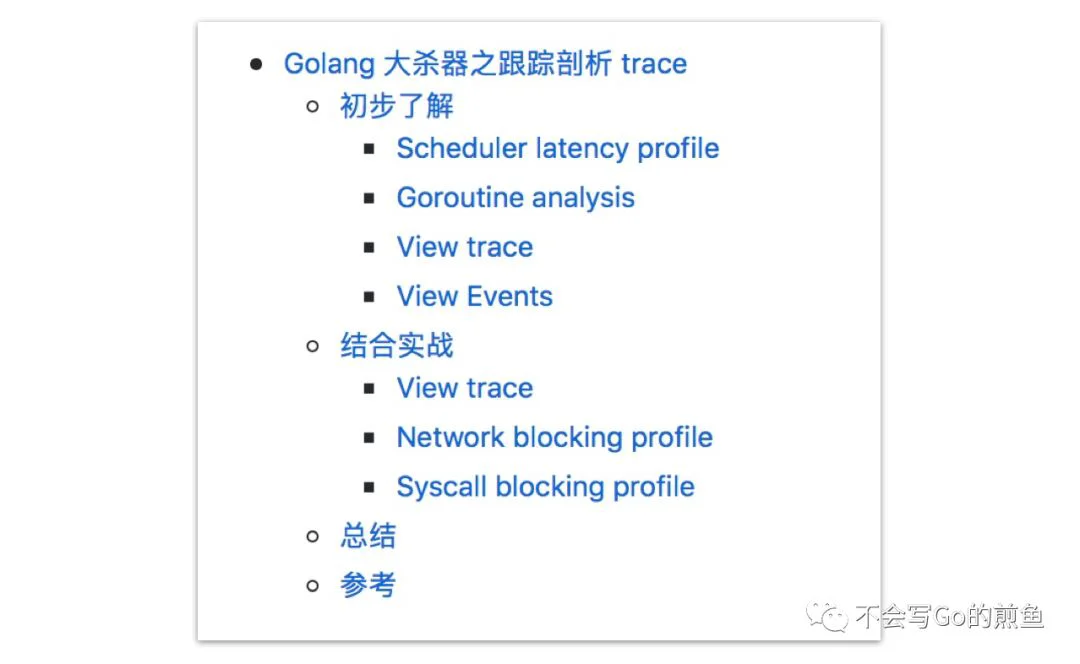
初步了解
import("os""runtime/trace")func main(){ trace.Start(os.Stderr) defer trace.Stop() ch := make(chan string) go func(){ ch <-"EDDYCJY"}()<-ch}生成跟踪文件:
$ go run main.go 2> trace.out启动可视化界面:
$ go tool trace trace.out2019/06/2216:14:52Parsing trace...2019/06/2216:14:52Splitting trace...2019/06/2216:14:52Opening browser.Trace viewer is listening on http://127.0.0.1:57321查看可视化界面:
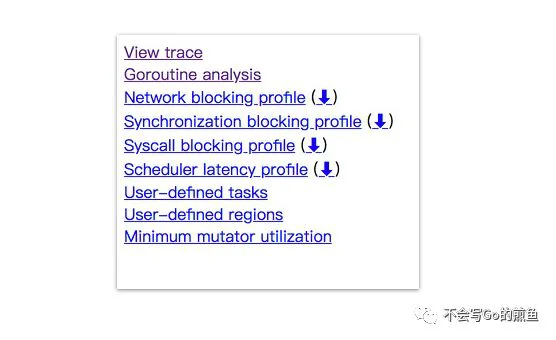
View trace:查看跟踪
Goroutine analysis:Goroutine 分析
Network blocking profile:网络阻塞概况
Synchronization blocking profile:同步阻塞概况
Syscall blocking profile:系统调用阻塞概况
Scheduler latency profile:调度延迟概况
User defined tasks:用户自定义任务
User defined regions:用户自定义区域
Minimum mutator utilization:最低 Mutator 利用率
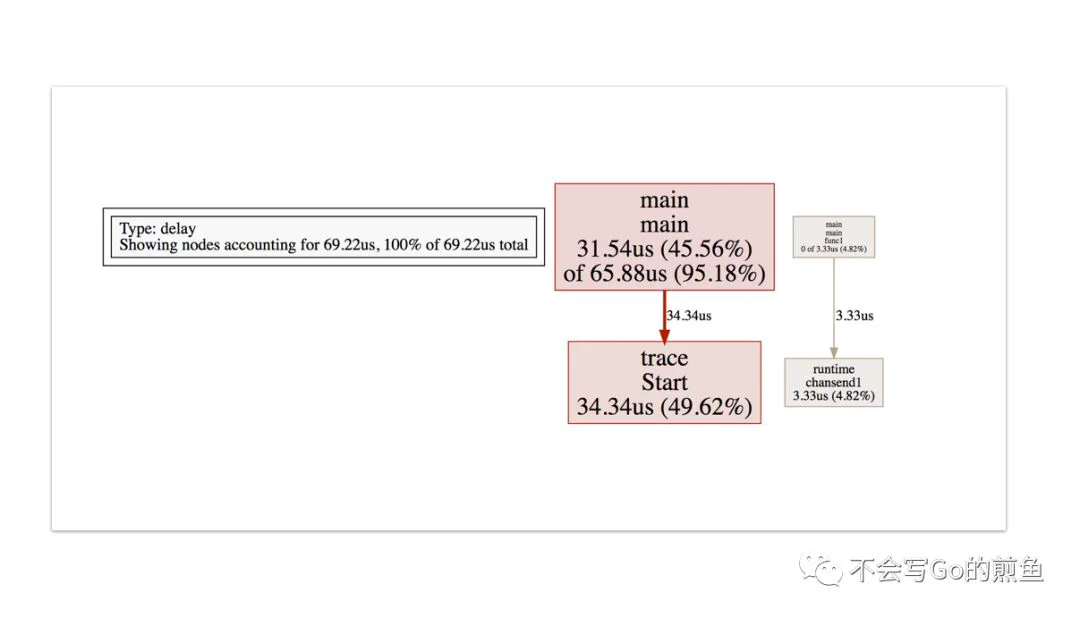
Scheduler latency profile
在刚开始时,我们一般先查看 “Scheduler latency profile”,我们能通过 Graph 看到整体的调用开销情况,如下:
tracechannelGoroutine analysis
第二步看 “Goroutine analysis”,我们能通过这个功能看到整个运行过程中,每个函数块有多少个有 Goroutine 在跑,并且观察每个的 Goroutine 的运行开销都花费在哪个阶段。如下:
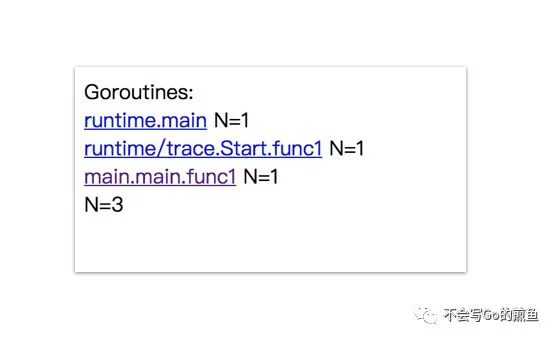
runtime.mainruntime/trace.Start.func1main.main.func1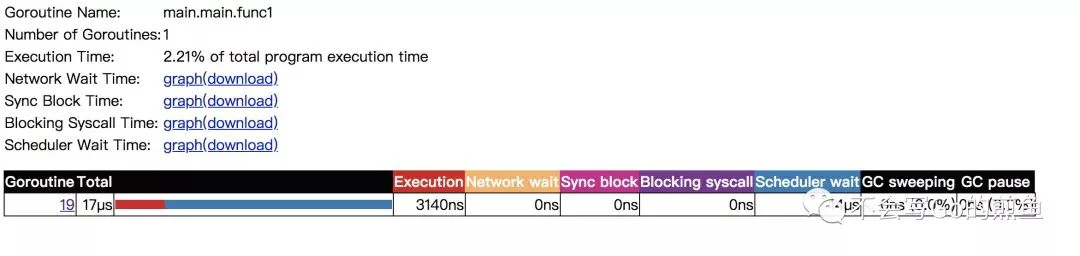
同时也可以看到当前 Goroutine 在整个调用耗时中的占比,以及 GC 清扫和 GC 暂停等待的一些开销。如果你觉得还不够,可以把图表下载下来分析,相当于把整个 Goroutine 运行时掰开来看了,这块能够很好的帮助我们对 Goroutine 运行阶段做一个的剖析,可以得知到底慢哪,然后再决定下一步的排查方向。如下:
| 名称 | 含义 | 耗时 |
|---|---|---|
| Execution Time | 执行时间 | 3140ns |
| Network Wait Time | 网络等待时间 | 0ns |
| Sync Block Time | 同步阻塞时间 | 0ns |
| Blocking Syscall Time | 调用阻塞时间 | 0ns |
| Scheduler Wait Time | 调度等待时间 | 14ns |
| GC Sweeping | GC 清扫 | 0ns |
| GC Pause | GC 暂停 | 0ns |
View trace
在对当前程序的 Goroutine 运行分布有了初步了解后,我们再通过 “查看跟踪” 看看之间的关联性,如下:
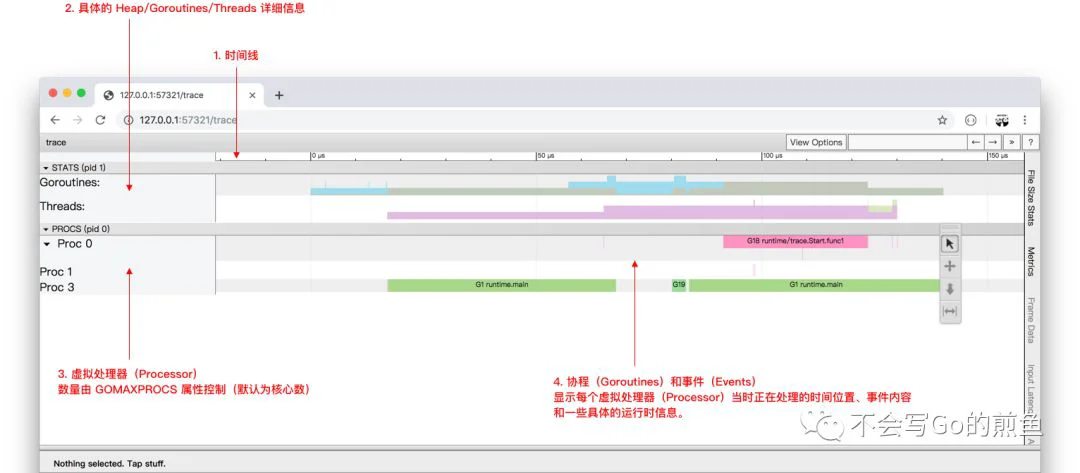
这个跟踪图粗略一看,相信有的小伙伴会比较懵逼,我们可以依据注解一块块查看,如下:
shift?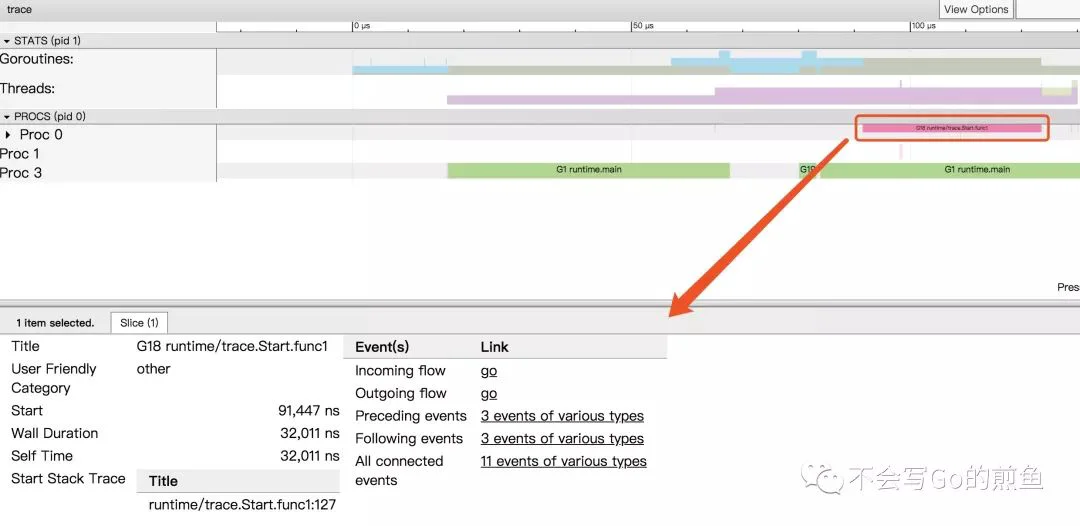
点击具体的 Goroutine 行为后可以看到其相关联的详细信息,这块很简单,大家实际操作一下就懂了。文字解释如下:
Start:开始时间
Wall Duration:持续时间
Self Time:执行时间
Start Stack Trace:开始时的堆栈信息
End Stack Trace:结束时的堆栈信息
Incoming flow:输入流
Outgoing flow:输出流
Preceding events:之前的事件
Following events:之后的事件
All connected:所有连接的事件
View Events
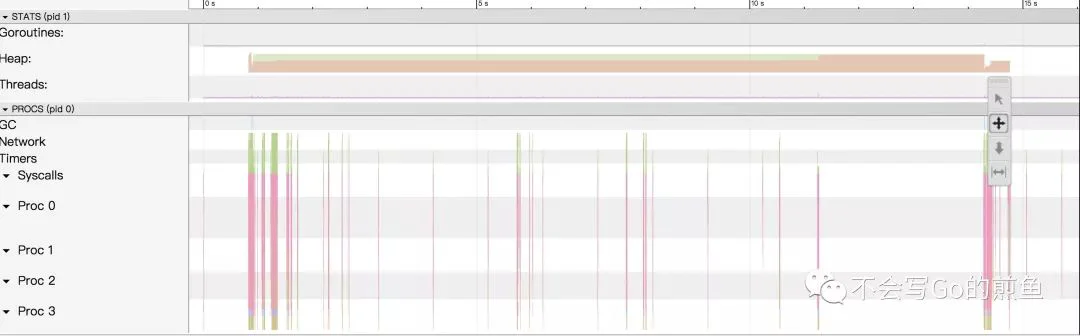
我们可以通过点击 View Options-Flow events、Following events 等方式,查看我们应用运行中的事件流情况。如下:
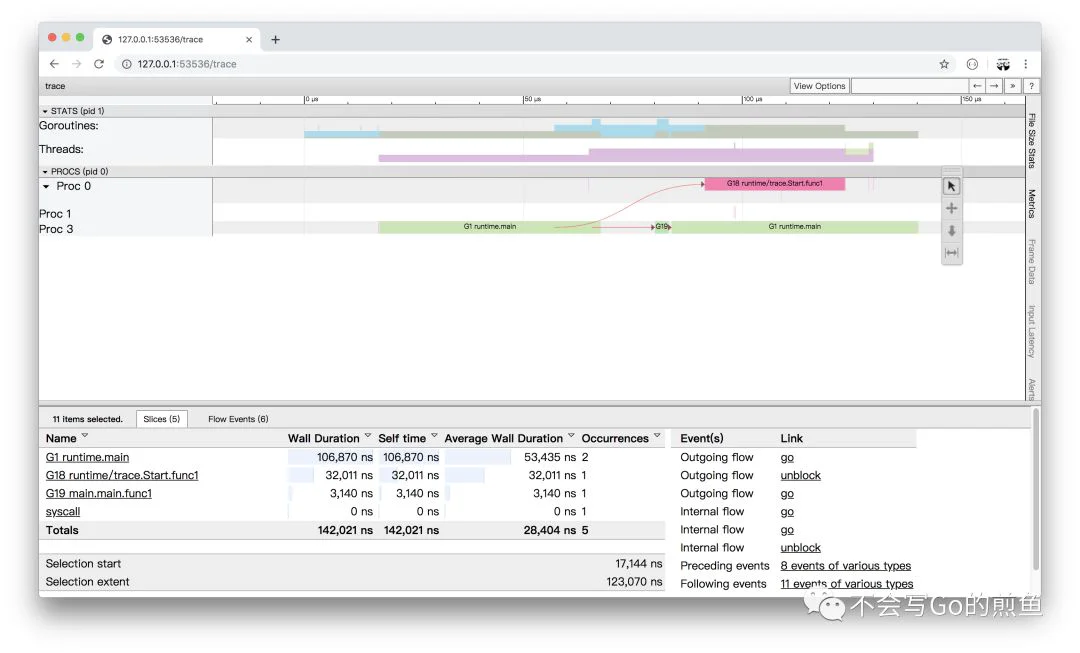
G1 runtime.mainG18 runtime/trace.Start.func1G19 main.main.func1runtime/trace.Start.func1main.mainruntime/trace.Startfunc1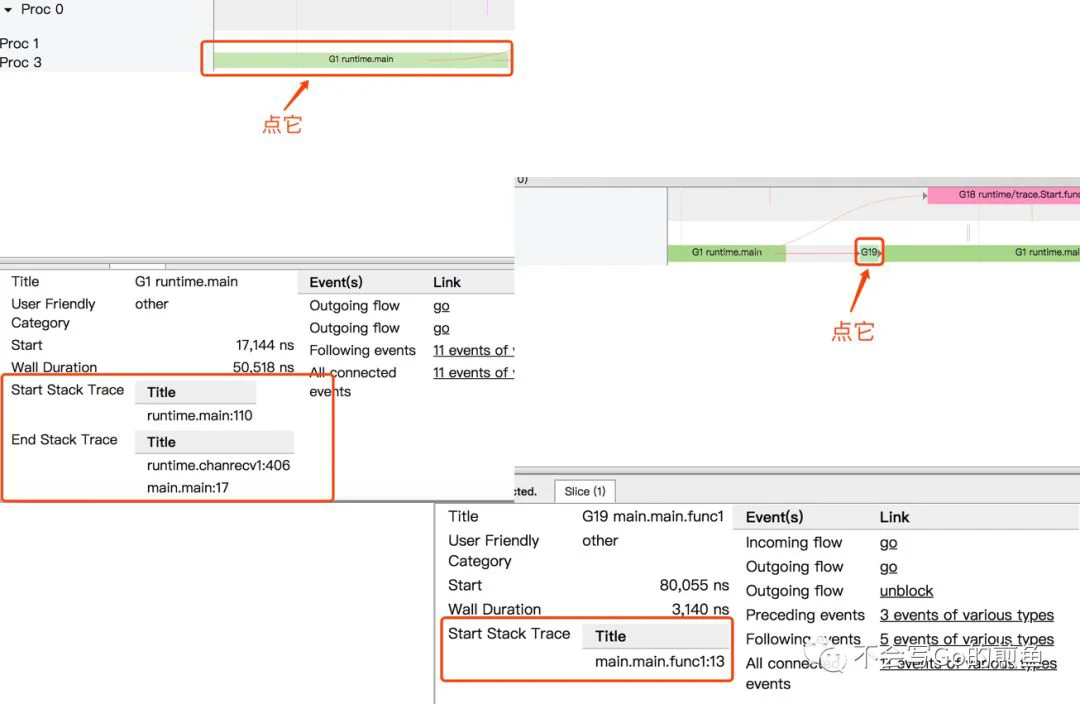
ch结合实战
_"net/http/pprof"curl http://127.0.0.1:6060/debug/pprof/trace?seconds=20 > trace.out
go tool trace trace.out
View trace
你很快的看到了熟悉的 List 界面,然后不信邪点开了 View trace 界面,如下:
W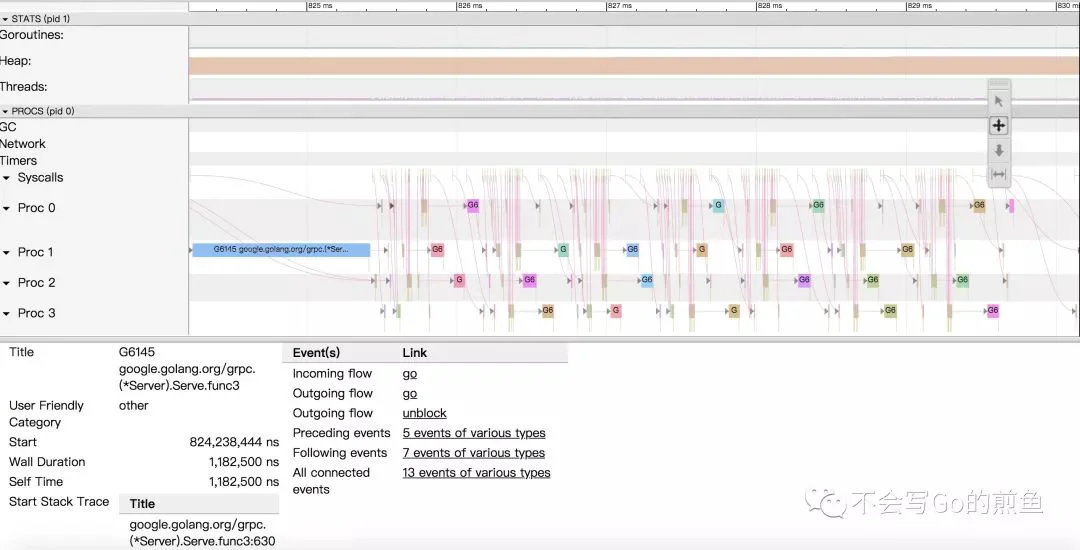
google.golang.org/grpc.(*Server).Serve.funcServe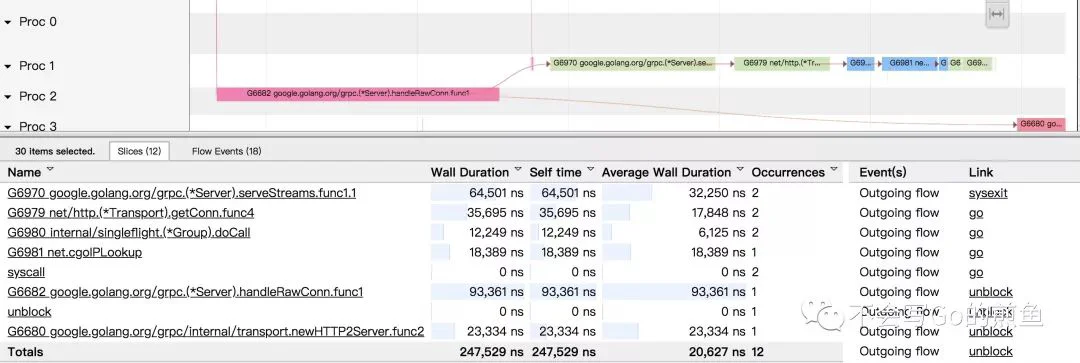
这时候有经验的你心里已经有了初步结论,你可以继续追踪 View trace 深入进去,不过我建议先鸟瞰全貌,因此我们再往下看 “Network blocking profile” 和 “Syscall blocking profile” 所提供的信息,如下:
Network blocking profile
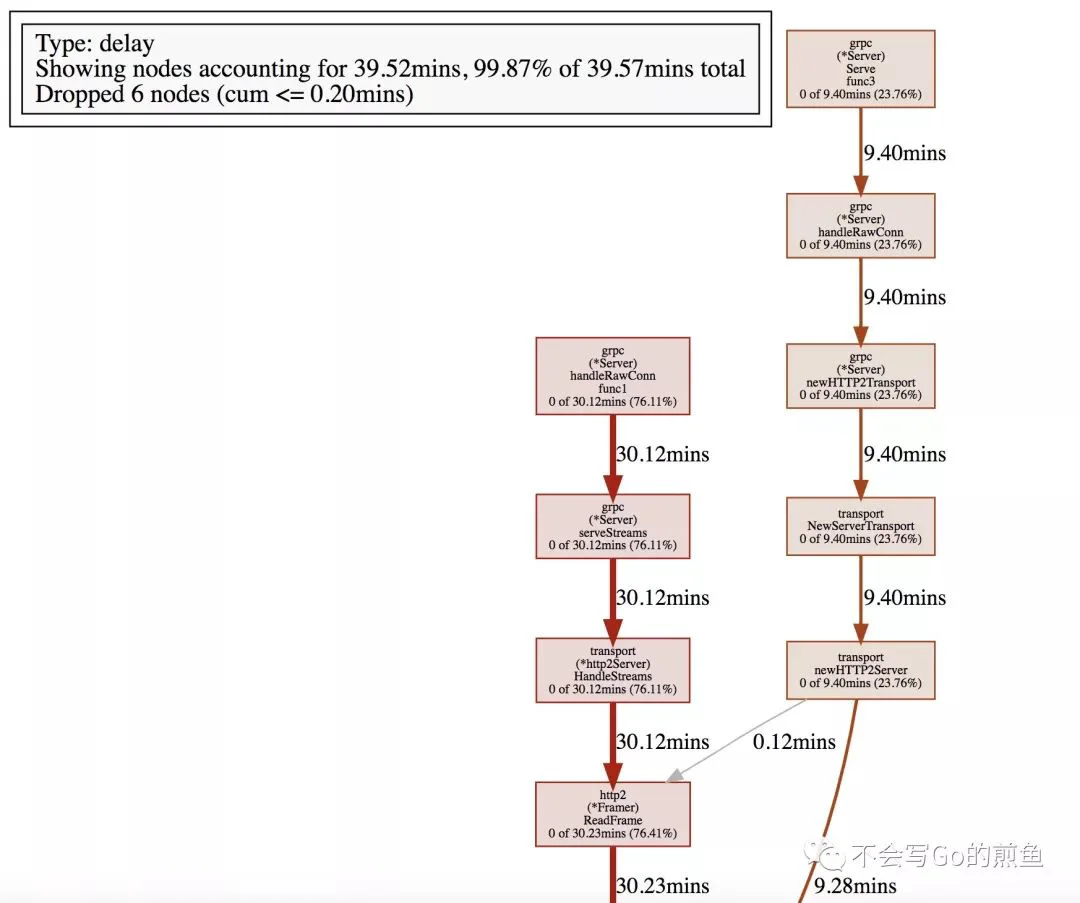
Syscall blocking profile
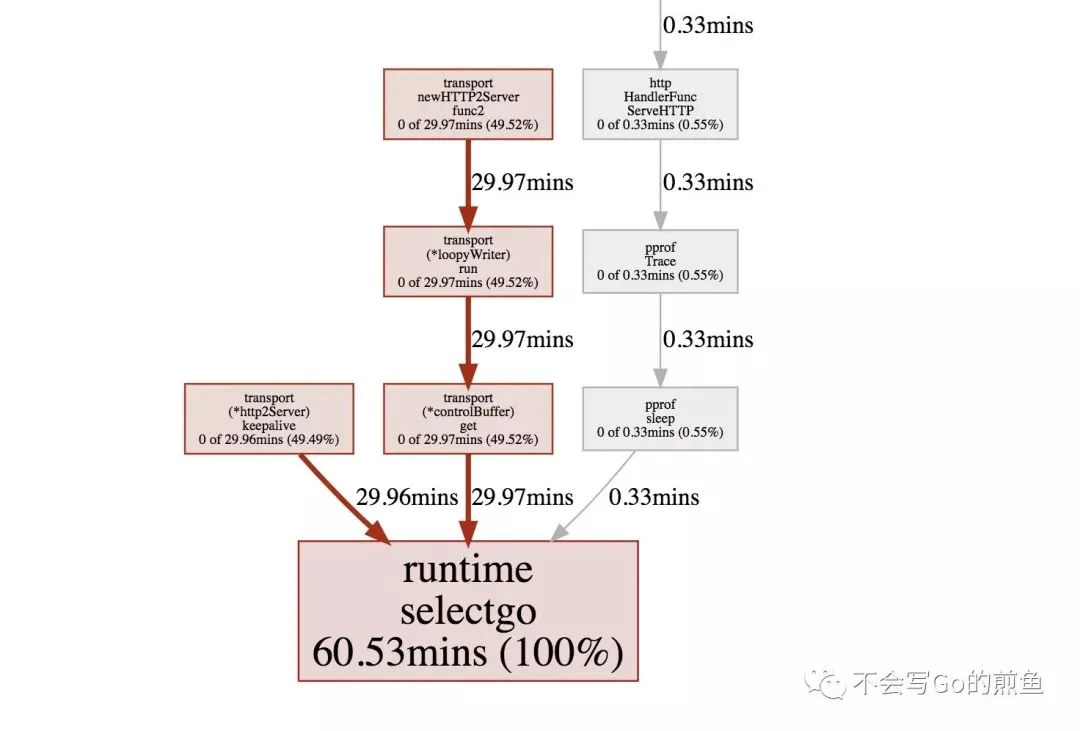
通过对以上三项的跟踪分析,加上这个泄露,这个阻塞的耗时,这个涉及的内部方法名,很明显就是哪位又忘记关闭客户端连接了,赶紧改改改。
总结
go tool trace希望你能够用好 Go 的两大杀器 pprof + trace 组合,此乃排查好搭档,谁用谁清楚,即使他并不万能。
参考
https://about.sourcegraph.com/go/an-introduction-to-go-tool-trace-rhys-hiltner
https://www.itcodemonkey.com/article/5419.html
https://making.pusher.com/go-tool-trace/
https://golang.org/cmd/trace/
https://docs.google.com/document/d/1FP5apqzBgr7ahCCgFO-yoVhk4YZrNIDNf9RybngBc14/pub
https://godoc.org/runtime/trace