
在程序中添加一行代码即可启动服务:
import _ "net/http/pprof"

func main() {
  http.ListenAndServe("0.0.0.0:6060", nil) // 启动服务
}
先启动程序:
go run .\main.go
使用方法
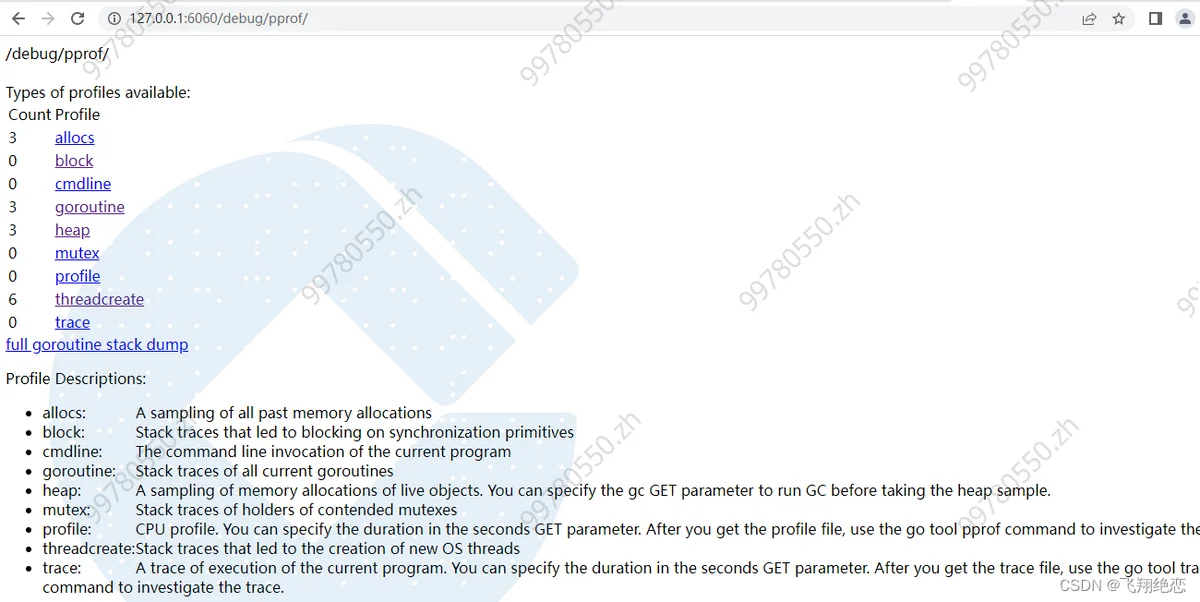
第一种:使用浏览器访问:http://127.0.0.1:6060/debug/pprof/
go tool pprof1)查看堆内存使用
在控制台输入:
PS E:\go\src\test> go tool pprof http://127.0.0.1:6060/debug/pprof/heap
Fetching profile over HTTP from http://127.0.0.1:6060/debug/pprof/heap
Saved profile in C:\Users\Administrator\pprof\pprof.alloc_objects.alloc_space.inuse_objects.inuse_space.010.pb.gz
Type: inuse_space
Time: Nov 9, 2022 at 10:42am (CST)
Entering interactive mode (type "help" for commands, "o" for options)
(pprof) top
Showing nodes accounting for 512.17kB, 100% of 512.17kB total
      flat  flat%   sum%        cum   cum%
  512.17kB   100%   100%   512.17kB   100%  net/textproto.(*Reader).ReadMIMEHeader
         0     0%   100%   512.17kB   100%  net/http.(*conn).readRequest
         0     0%   100%   512.17kB   100%  net/http.(*conn).serve
         0     0%   100%   512.17kB   100%  net/http.readRequest
(pprof)
top 命令会列出5个统计数据:
flat: 本函数占用的内存量
flat%: 本函数内存占使用内存总量的百分比
sum%: 前面每一行flat百分比的和
cum: 累计量,main函数调用了函数f,函数f占用的内存量,也会记录进来
cum%: 累计量占总量的百分比
2)查看goruntine
在控制台输入:
PS E:\go\src\test> go tool pprof http://127.0.0.1:6060/debug/pprof/goroutine
Fetching profile over HTTP from http://127.0.0.1:6060/debug/pprof/goroutine
Saved profile in C:\Users\Administrator\pprof\pprof.goroutine.001.pb.gz
Type: goroutine
Time: Nov 9, 2022 at 10:49am (CST)
Entering interactive mode (type "help" for commands, "o" for options)
(pprof) top
Showing nodes accounting for 3, 100% of 3 total
Showing top 10 nodes out of 26
      flat  flat%   sum%        cum   cum%
         1 33.33% 33.33%          1 33.33%  net/http.(*connReader).backgroundRead
         1 33.33% 66.67%          1 33.33%  runtime.gopark
         1 33.33%   100%          1 33.33%  runtime/pprof.runtime_goroutineProfileWithLabels
         0     0%   100%          1 33.33%  internal/poll.(*FD).Accept
         0     0%   100%          1 33.33%  internal/poll.(*FD).acceptOne
         0     0%   100%          1 33.33%  internal/poll.(*pollDesc).wait
         0     0%   100%          1 33.33%  internal/poll.execIO
         0     0%   100%          1 33.33%  internal/poll.runtime_pollWait
         0     0%   100%          1 33.33%  main.main
         0     0%   100%          1 33.33%  net.(*TCPListener).Accept
(pprof) traces
Type: goroutine
Time: Nov 9, 2022 at 10:49am (CST)
-----------+-------------------------------------------------------
         1   runtime.gopark
             runtime.netpollblock
             internal/poll.runtime_pollWait
             internal/poll.(*pollDesc).wait
             internal/poll.execIO
             internal/poll.(*FD).acceptOne
             internal/poll.(*FD).Accept
             net.(*netFD).accept
             runtime/pprof.writeGoroutine
             runtime/pprof.(*Profile).WriteTo
             net/http/pprof.handler.ServeHTTP
             net/http/pprof.Index
             net/http.HandlerFunc.ServeHTTP
             net/http.(*ServeMux).ServeHTTP
             net/http.serverHandler.ServeHTTP
             net/http.(*conn).serve
-----------+-------------------------------------------------------
         1   net/http.(*connReader).backgroundRead
-----------+-------------------------------------------------------