
程序运行时主要关注的四个方面
- CPU占用
- 内存占用
- 死锁
- 协程信息
一、 嵌入应用收集数据
1. 一次性执行应用
// cpu
f, err := os.Create(*cpuprofile)
pprof.StartCPUProfile(f)
defer pprof.StopCPUProfile()

// mem
f, err := os.Create(*memprofile)
pprof.WriteHeapProfile(f)
f.Close()
2.后台应用
[如果是http应用就直接添加路由,否则就启动一个httpserver]
如果使用了默认的 http.DefaultServeMux(通常是代码直接使用
http.ListenAndServe("0.0.0.0:8000", nil)),
只需要添加一行:
import _ "net/http/pprof"

如果你使用自定义的 Mux,则需要手动注册一些路由规则:
r.HandleFunc("/debug/pprof/", pprof.Index)
r.HandleFunc("/debug/pprof/cmdline", pprof.Cmdline)
r.HandleFunc("/debug/pprof/profile", pprof.Profile)
r.HandleFunc("/debug/pprof/symbol", pprof.Symbol)
r.HandleFunc("/debug/pprof/trace", pprof.Trace)
访问/debug/pprof/
/debug/pprof/

profiles:
0    block
62    goroutine
444    heap
30    threadcreate

full goroutine stack dump
这个路径下还有几个子页面:
/debug/pprof/profile/debug/pprof/heap/debug/pprof/block/debug/pprof/goroutinesgo tool pprof -http :8090 http://image-urlgen.int.yidian-inc.com/debug/pprof/profile\?seconds\=10
go tool pprof ./hyperkube http://172.16.3.232:10251/debug/pprof/profile
二、获取分析Profiling数据
go tool pprofgo tool pprof [binary] [source]binarysource1. 分析cpu占用
➜  go tool pprof ./hyperkube http://172.16.3.232:10251/debug/pprof/profile
Fetching profile from http://172.16.3.232:10251/debug/pprof/profile
Please wait... (30s)
Saved profile in /home/cizixs/pprof/pprof.hyperkube.172.16.3.232:10251.samples.cpu.002.pb.gz
Entering interactive mode (type "help" for commands)
(pprof)
?seconds=60topN(pprof) top10
130ms of 360ms total (36.11%)
Showing top 10 nodes out of 180 (cum >= 10ms)
flat flat% sum% cum cum%
20ms 5.56% 5.56% 100ms 27.78% encoding/json.(*decodeState).object
20ms 5.56% 11.11% 20ms 5.56% runtime.(*mspan).refillAllocCache
20ms 5.56% 16.67% 20ms 5.56% runtime.futex
10ms 2.78% 19.44% 10ms 2.78% encoding/json.(*decodeState).literalStore
10ms 2.78% 22.22% 10ms 2.78% encoding/json.(*decodeState).scanWhile
10ms 2.78% 25.00% 40ms 11.11% encoding/json.checkValid
10ms 2.78% 27.78% 10ms 2.78% encoding/json.simpleLetterEqualFold
10ms 2.78% 30.56% 10ms 2.78% encoding/json.stateBeginValue
10ms 2.78% 33.33% 10ms 2.78% encoding/json.stateEndValue
10ms 2.78% 36.11% 10ms 2.78% encoding/json.stateInString
累加值 cumulative
toplistdisasmwebwebsvg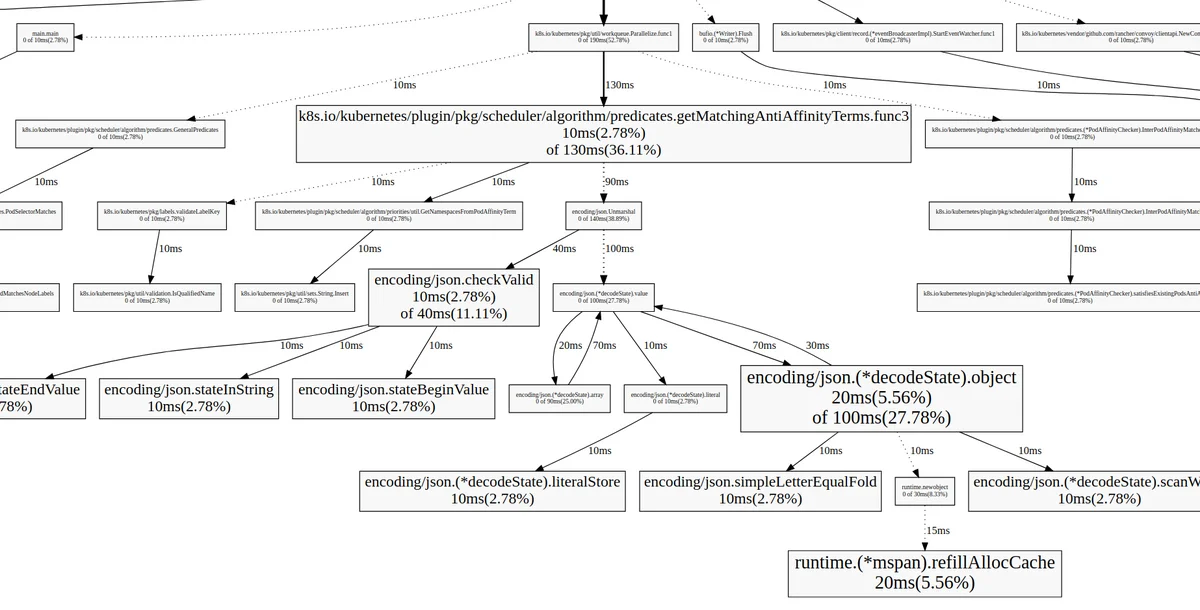
encoding/json.(*decodeState).objectpproflist(pprof) list podFitsOnNode
Total: 120ms
ROUTINE ======================== k8s.io/kubernetes/plugin/pkg/scheduler.podFitsOnNode in /home/cizixs/go/src/k8s.io/kubernetes/_output/local/go/src/k8s.io/kubernetes/plugin/pkg/scheduler/generic_scheduler.go
0 20ms (flat, cum) 16.67% of Total
. . 230:
. . 231:// Checks whether node with a given name and NodeInfo satisfies all predicateFuncs.
. . 232:func podFitsOnNode(pod *api.Pod, meta interface{}, info *schedulercache.NodeInfo, predicateFuncs map[string]algorithm.FitPredicate) (bool, []algorithm.PredicateFailureReason, error) {
. . 233: var failedPredicates []algorithm.PredicateFailureReason
. . 234: for _, predicate := range predicateFuncs {
. 20ms 235: fit, reasons, err := predicate(pod, meta, info)
. . 236: if err != nil {
. . 237: err := fmt.Errorf("SchedulerPredicates failed due to %v, which is unexpected.", err)
. . 238: return false, []algorithm.PredicateFailureReason{}, err
. . 239: }
. . 240: if !fit {
disadm weblist 2. 分析内存占用
Memory Profiling
/debug/pprof/profile/debug/pprof/heap➜ go tool pprof ./hyperkube http://172.16.3.232:10251/debug/pprof/heap
Fetching profile from http://172.16.3.232:10251/debug/pprof/heap
Saved profile in /home/cizixs/pprof/pprof.hyperkube.172.16.3.232:10251.inuse_objects.inuse_space.002.pb.gz
Entering interactive mode (type "help" for commands)
(pprof)
top N(pprof) top
11712.11kB of 14785.10kB total (79.22%)
Dropped 580 nodes (cum <= 73.92kB)
Showing top 10 nodes out of 146 (cum >= 512.31kB)
flat flat% sum% cum cum%
2072.09kB 14.01% 14.01% 2072.09kB 14.01% k8s.io/kubernetes/vendor/github.com/beorn7/perks/quantile.NewTargeted
2049.25kB 13.86% 27.87% 2049.25kB 13.86% k8s.io/kubernetes/pkg/api/v1.(*ResourceRequirements).Unmarshal
1572.28kB 10.63% 38.51% 1572.28kB 10.63% k8s.io/kubernetes/vendor/github.com/beorn7/perks/quantile.(*stream).merge
1571.34kB 10.63% 49.14% 1571.34kB 10.63% regexp.(*bitState).reset
1184.27kB 8.01% 57.15% 1184.27kB 8.01% bytes.makeSlice
1024.16kB 6.93% 64.07% 1024.16kB 6.93% k8s.io/kubernetes/pkg/api/v1.(*ObjectMeta).Unmarshal
613.99kB 4.15% 68.23% 2150.63kB 14.55% k8s.io/kubernetes/pkg/api/v1.(*PersistentVolumeClaimList).Unmarshal
591.75kB 4.00% 72.23% 1103.79kB 7.47% reflect.Value.call
520.67kB 3.52% 75.75% 520.67kB 3.52% k8s.io/kubernetes/vendor/github.com/gogo/protobuf/proto.RegisterType
512.31kB 3.47% 79.22% 512.31kB 3.47% k8s.io/kubernetes/pkg/api/v1.(*PersistentVolumeClaimStatus).Unmarshal
每一列的含义是类似的,只不过从 CPU 使用时间变成了内存使用大小
--inuse_objects--alloc-space这里还要提两个比较有用的方法,如果应用比较复杂,生成的调用图特别大,看起来很乱,有两个办法可以优化:
web funcNamego tool pprof--nodefration=0.05并且pprof支持动态的 web 浏览方式
3. 分析goroutine占用
从 /debug/pprof/profile 改成 /debug/pprof/goroutine
traces命令可以查看栈详情、
list可以查看具体的某一个
top可以查看前几个
3. 其他
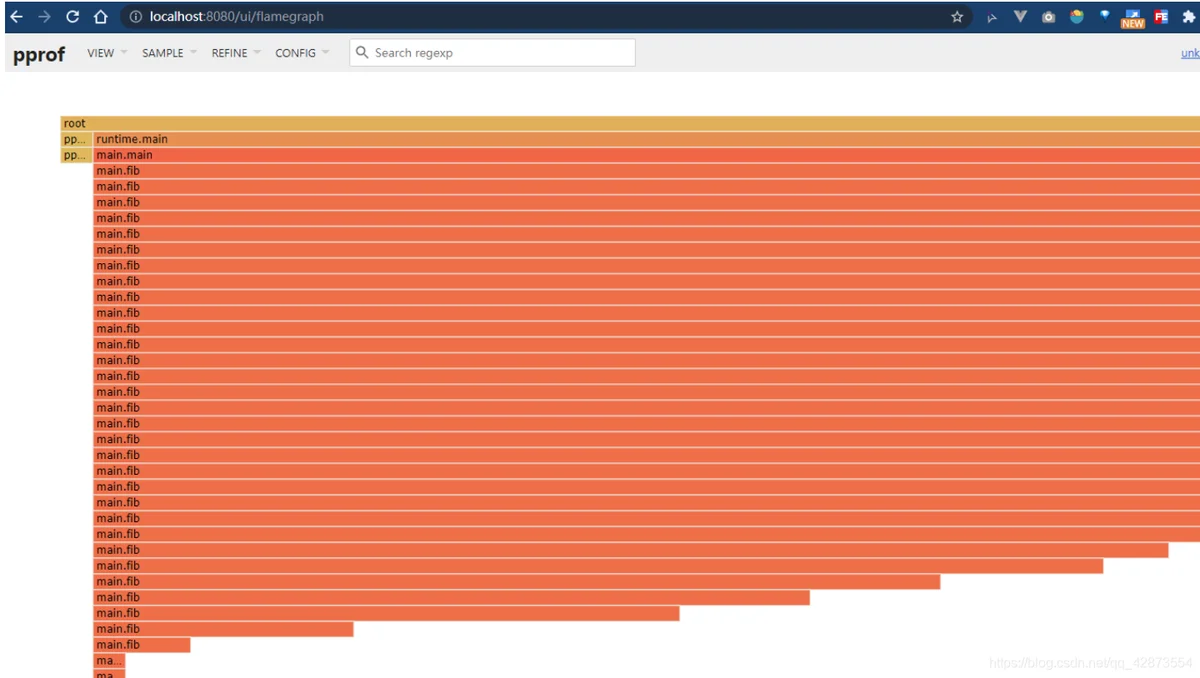
1. 火焰图
go1.11之前使用go-torch,之后go tool pprof已经集成了火焰图
2. 和测试工具的集成
go test 命令有两个参数和 pprof 相关,它们分别指定生成的 CPU 和 Memory profiling 保存的文件:
-cpuprofile-memprofilecpu.prof$ go test -bench . -cpuprofile=cpu.prof
main.testcpu.profgo tool pprofmain.test需要注意的是,Profiling 一般和性能测试一起使用,这个原因在前文也提到过,只有应用在负载高的情况下 Profiling 才有意义。
相关链接:
https://cizixs.com/2017/09/11/profiling-golang-program/
https://darjun.github.io/2021/06/09/youdontknowgo/pprof/
https://pkg.go.dev/net/http/pprof
https://go.dev/blog/pprof
https://www.cnblogs.com/qcrao-2018/p/11832732.html
https://segmentfault.com/a/1190000016412013