GC 的优化问题 #
GC 关注的指标有哪些? #
Go 的 GC 被设计为成比例触发、大部分工作与赋值器并发、不分代、无内存移动且会主动向操作系统归还申请的内存。因此最主要关注的、能够影响赋值器的性能指标有:
CPU 利用率:回收算法会在多大程度上拖慢程序?有时候,这个是通过回收占用的 CPU 时间与其它 CPU 时间的百分比来描述的。
GC 停顿频率:回收器造成的停顿频率是怎样的?目前的 GC 中需要考虑 STW 和 Mark Assist 两个部分可能造成的停顿。
GC 可扩展性:当堆内存变大时,垃圾回收器的性能如何?但大部分的程序可能并不一定关心这个问题。
Go 的 GC 如何调优? #
Go 的 GC 被设计为极致简洁,与较为成熟的 Java GC 的数十个可控参数相比,严格意义上来讲,Go 可供用户调整的参数只有 GOGC 环境变量。当我们谈论 GC 调优时,通常是指减少用户代码对 GC 产生的压力,这一方面包含了减少用户代码分配内存的数量(即对程序的代码行为进行调优),另一方面包含了最小化 Go 的 GC 对 CPU 的使用率(即调整 GOGC)。
GC 的调优是在特定场景下产生的,并非所有程序都需要针对 GC 进行调优。只有那些对执行延迟非常敏感、 当 GC 的开销成为程序性能瓶颈的程序,才需要针对 GC 进行性能调优,几乎不存在于实际开发中 99% 的情况。 除此之外,Go 的 GC 也仍然有一定的可改进的空间,也有部分 GC 造成的问题,目前仍属于 Open Problem。
总的来说,我们可以在现在的开发中处理的有以下几种情况:
对停顿敏感:GC 过程中产生的长时间停顿、或由于需要执行 GC 而没有执行用户代码,导致需要立即执行的用户代码执行滞后。
对资源消耗敏感:对于频繁分配内存的应用而言,频繁分配内存增加 GC 的工作量,原本可以充分利用 CPU 的应用不得不频繁地执行垃圾回收,影响用户代码对 CPU 的利用率,进而影响用户代码的执行效率。
从这两点来看,所谓 GC 调优的核心思想也就是充分的围绕上面的两点来展开:优化内存的申请速度,尽可能的少申请内存,复用已申请的内存。或者简单来说,不外乎这三个关键字:控制、减少、复用。
我们将通过三个实际例子介绍如何定位 GC 的存在的问题,并一步一步进行性能调优。当然,在实际情况中问题远比这些例子要复杂,这里也只是讨论调优的核心思想,更多的时候也只能具体问题具体分析。
例1:合理化内存分配的速度、提高赋值器的 CPU 利用率 #
1
2
3
4
5
6
7
8
9
10
11
12
13
14
15
16
17
18
19
20
21
22
23
24
25
26
27
28
29
30
31
32
33
34
35
36
37
38
39
40
41
42
43
44
45
46
47
48
49
50
package main
import (
"fmt"
"os"
"runtime"
"runtime/trace"
"sync/atomic"
"time"
)
var (
stop int32
count int64
sum time.Duration
)
func concat() {
for n := 0; n < 100; n++ {
for i := 0; i < 8; i++ {
go func() {
s := "Go GC"
s += " " + "Hello"
s += " " + "World"
_ = s
}()
}
}
}
func main() {
f, _ := os.Create("trace.out")
defer f.Close()
trace.Start(f)
defer trace.Stop()
go func() {
var t time.Time
for atomic.LoadInt32(&stop) == 0 {
t = time.Now()
runtime.GC()
sum += time.Since(t)
count++
}
fmt.Printf("GC spend avg: %v\n", time.Duration(int64(sum)/count))
}()
concat()
atomic.StoreInt32(&stop, 1)
}
这个程序的执行结果是:
1
2
3
$ go build -o main
$ ./main
GC spend avg: 2.583421ms
GC 平均执行一次需要长达 2ms 的时间,我们再进一步观察 trace 的结果:
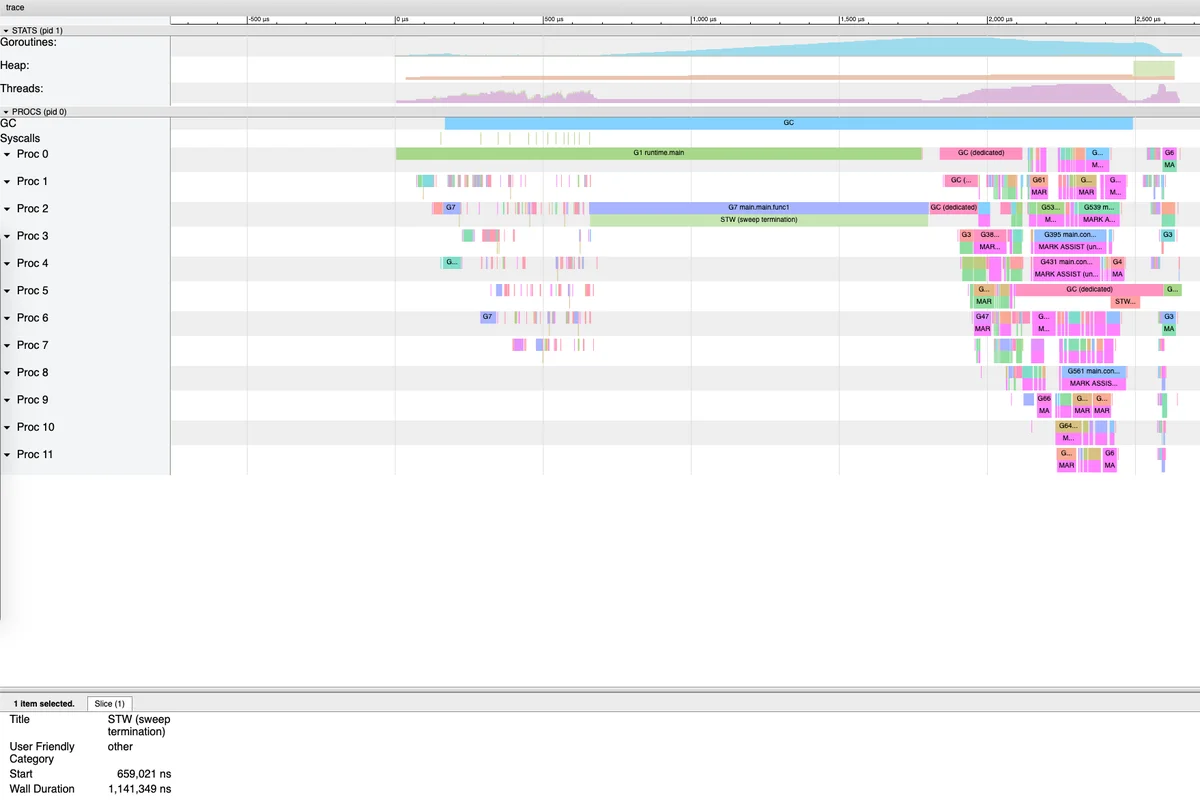
程序的整个执行过程中仅执行了一次 GC,而且仅 Sweep STW 就耗费了超过 1 ms,非常反常。甚至查看赋值器 mutator 的 CPU 利用率,在整个 trace 尺度下连 40% 都不到:
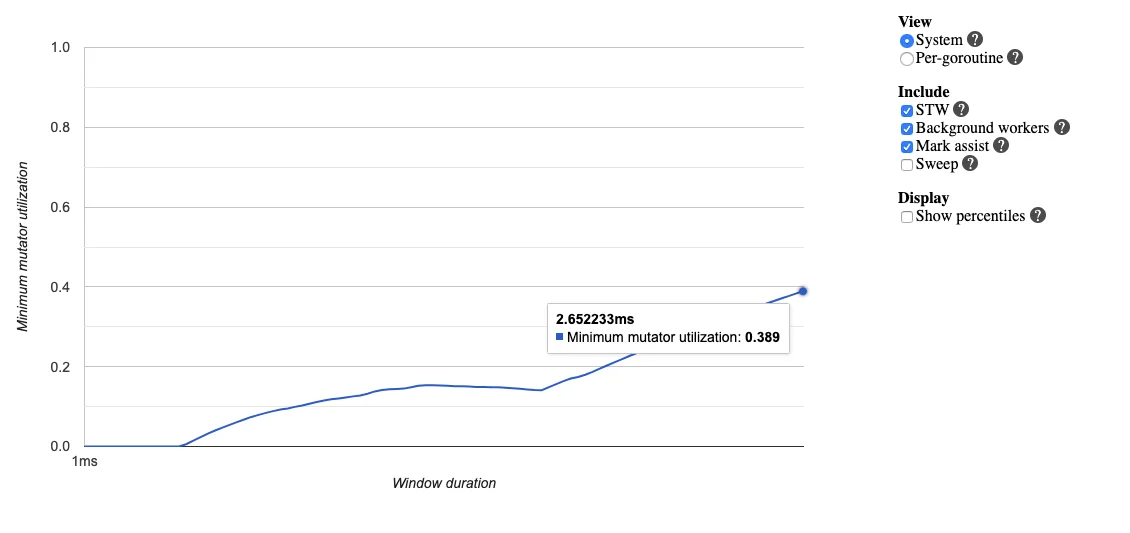
主要原因是什么呢?我们不妨查看 goroutine 的分析:
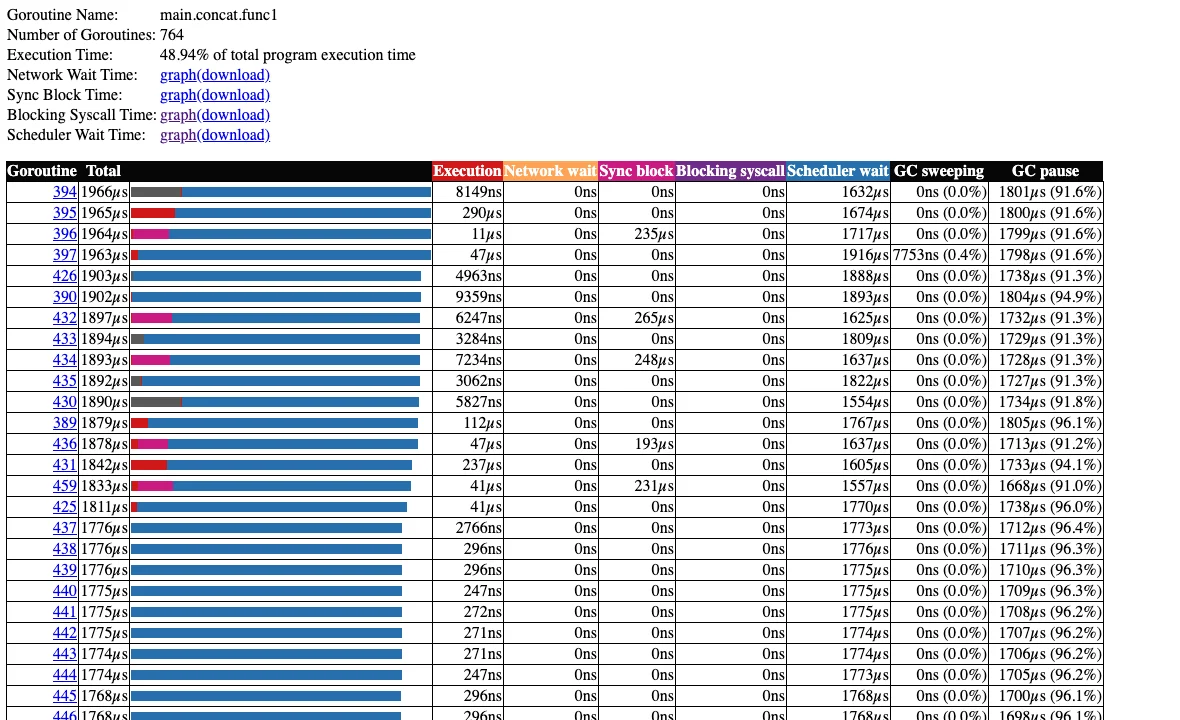
在这个榜单中我们不难发现,goroutine 的执行时间占其生命周期总时间非常短的一部分,但大部分时间都花费在调度器的等待上了(蓝色的部分),说明同时创建大量 goroutine 对调度器产生的压力确实不小,我们不妨将这一产生速率减慢,一批一批地创建 goroutine:
1
2
3
4
5
6
7
8
9
10
11
12
13
14
15
16
func concat() {
wg := sync.WaitGroup{}
for n := 0; n < 100; n++ {
wg.Add(8)
for i := 0; i < 8; i++ {
go func() {
s := "Go GC"
s += " " + "Hello"
s += " " + "World"
_ = s
wg.Done()
}()
}
wg.Wait()
}
}
这时候我们再来看:
1
2
3
$ go build -o main
$ ./main
GC spend avg: 328.54µs
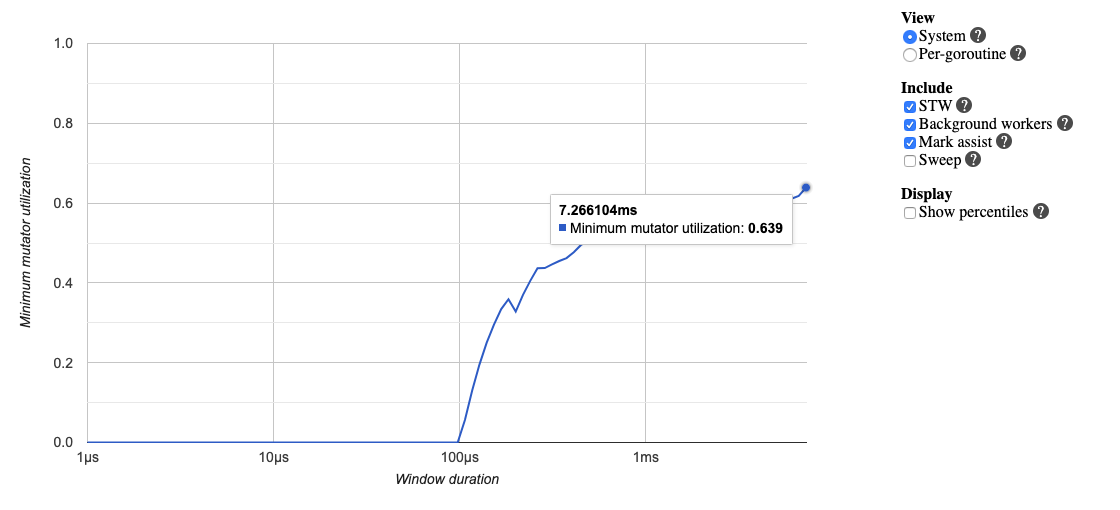
GC 的平均时间就降到 300 微秒了。这时的赋值器 CPU 使用率也提高到了 60%,相对来说就很可观了:
当然,这个程序仍然有优化空间,例如我们其实没有必要等待很多 goroutine 同时执行完毕才去执行下一组 goroutine。而可以当一个 goroutine 执行完毕时,直接启动一个新的 goroutine,也就是 goroutine 池的使用。 有兴趣的读者可以沿着这个思路进一步优化这个程序中赋值器对 CPU 的使用率。
例2:降低并复用已经申请的内存 #
我们通过一个非常简单的 Web 程序来说明复用内存的重要性。在这个程序中,每当产生一个 /example2 的请求时,都会创建一段内存,并用于进行一些后续的工作。
1
2
3
4
5
6
7
8
9
10
11
12
13
14
15
16
17
18
19
20
21
22
23
24
25
26
27
28
29
package main
import (
"fmt"
"net/http"
_ "net/http/pprof"
)
func newBuf() []byte {
return make([]byte, 10<<20)
}
func main() {
go func() {
http.ListenAndServe("localhost:6060", nil)
}()
http.HandleFunc("/example2", func(w http.ResponseWriter, r *http.Request) {
b := newBuf()
// 模拟执行一些工作
for idx := range b {
b[idx] = 1
}
fmt.Fprintf(w, "done, %v", r.URL.Path[1:])
})
http.ListenAndServe(":8080", nil)
}
为了进行性能分析,我们还额外创建了一个监听 6060 端口的 goroutine,用于使用 pprof 进行分析。 我们先让服务器跑起来:
1
2
$ go build -o main
$ ./main
我们这次使用 pprof 的 trace 来查看 GC 在此服务器中面对大量请求时候的状态,要使用 trace 可以通过访问 /debug/pprof/trace 路由来进行,其中 seconds 参数设置为 20s,并将 trace 的结果保存为 trace.out:
1
2
3
4
$ wget http://127.0.0.1:6060/debug/pprof/trace\?seconds\=20 -O trace.out
--2020-01-01 22:13:34-- http://127.0.0.1:6060/debug/pprof/trace?seconds=20
Connecting to 127.0.0.1:6060... connected.
HTTP request sent, awaiting response...
这时候我们使用一个压测工具 ab,来同时产生 500 个请求 (-n 一共 500 个请求,-c 一个时刻执行请求的数量,每次 100 个并发请求):
1
2
3
4
5
6
7
8
9
10
11
12
13
14
15
16
17
18
19
20
21
22
23
24
25
26
27
28
29
30
31
32
33
34
35
36
37
38
39
40
41
42
43
44
45
46
47
48
49
go tool trace trace.out
$ ab -n 500 -c 100 http://127.0.0.1:8080/example2
This is ApacheBench, Version 2.3 <$Revision: 1843412 $>
Copyright 1996 Adam Twiss, Zeus Technology Ltd, http://www.zeustech.net/
Licensed to The Apache Software Foundation, http://www.apache.org/
Benchmarking 127.0.0.1 (be patient)
Completed 100 requests
Completed 200 requests
Completed 300 requests
Completed 400 requests
Completed 500 requests
Finished 500 requests
Server Software:
Server Hostname: 127.0.0.1
Server Port: 8080
Document Path: /example2
Document Length: 14 bytes
Concurrency Level: 100
Time taken for tests: 0.987 seconds
Complete requests: 500
Failed requests: 0
Total transferred: 65500 bytes
HTML transferred: 7000 bytes
Requests per second: 506.63 [#/sec] (mean)
Time per request: 197.382 [ms] (mean)
Time per request: 1.974 [ms] (mean, across all concurrent requests)
Transfer rate: 64.81 [Kbytes/sec] received
Connection Times (ms)
min mean[+/-sd] median max
Connect: 0 1 1.1 0 7
Processing: 13 179 77.5 170 456
Waiting: 10 168 78.8 162 455
Total: 14 180 77.3 171 458
Percentage of the requests served within a certain time (ms)
50% 171
66% 203
75% 222
80% 239
90% 281
95% 335
98% 365
99% 400
100% 458 (longest request)
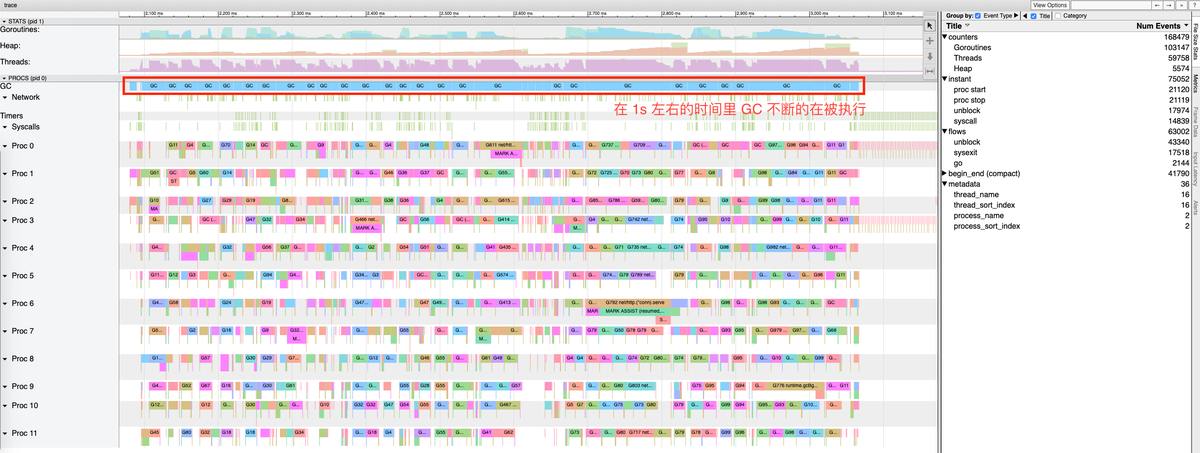
GC 反复被触发,一个显而易见的原因就是内存分配过多。我们可以通过 go tool pprof 来查看究竟是谁分配了大量内存(使用 web 指令来使用浏览器打开统计信息的可视化图形):
1
2
3
4
5
6
7
8
9
$ go tool pprof http://127.0.0.1:6060/debug/pprof/heap
Fetching profile over HTTP from http://localhost:6060/debug/pprof/heap
Saved profile in /Users/changkun/pprof/pprof.alloc_objects.alloc_space.inuse_o
bjects.inuse_space.003.pb.gz
Type: inuse_space
Time: Jan 1, 2020 at 11:15pm (CET)
Entering interactive mode (type "help" for commands, "o" for options)
(pprof) web
(pprof)
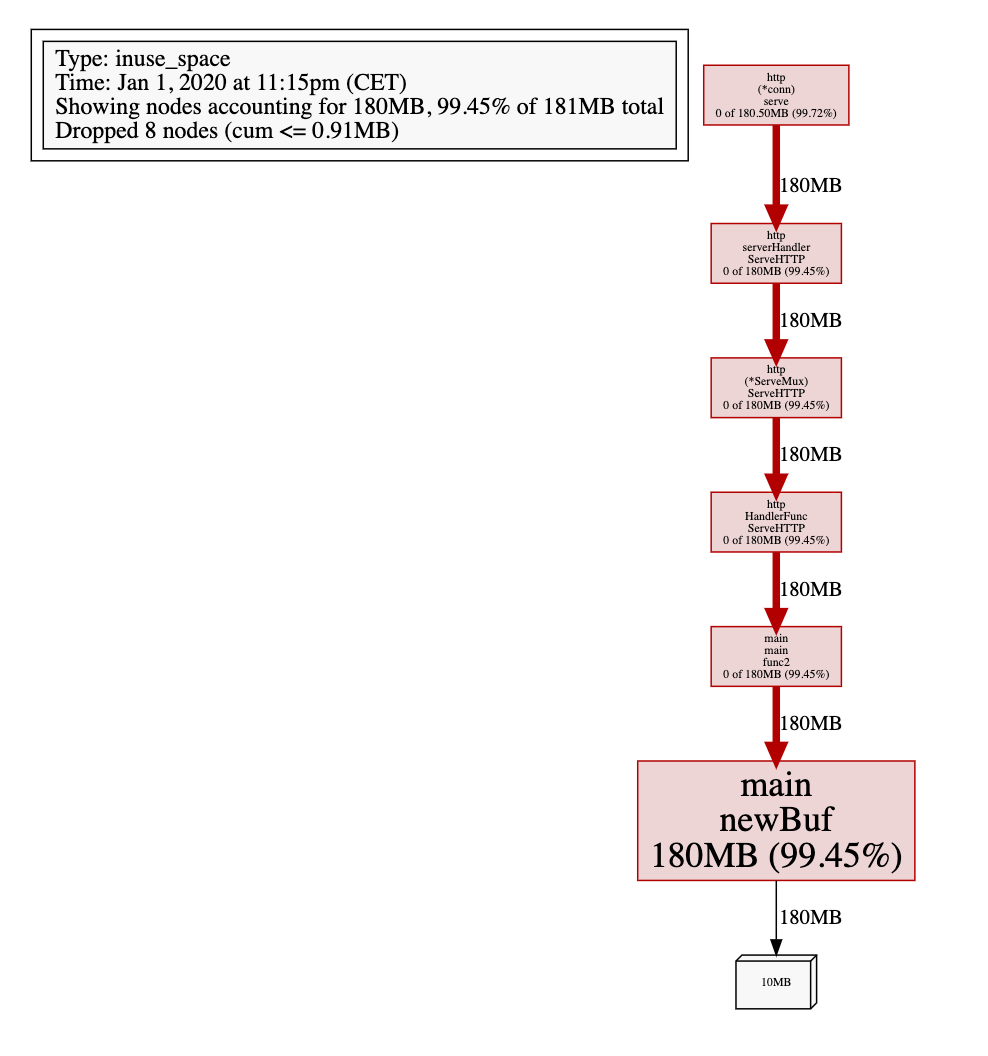
可见 newBuf 产生的申请的内存过多,现在我们使用 sync.Pool 来复用 newBuf 所产生的对象:
1
2
3
4
5
6
7
8
9
10
11
12
13
14
15
16
17
18
19
20
21
22
23
24
25
26
27
28
29
30
package main
import (
"fmt"
"net/http"
_ "net/http/pprof"
"sync"
)
// 使用 sync.Pool 复用需要的 buf
var bufPool = sync.Pool{
New: func() interface{} {
return make([]byte, 10<<20)
},
}
func main() {
go func() {
http.ListenAndServe("localhost:6060", nil)
}()
http.HandleFunc("/example2", func(w http.ResponseWriter, r *http.Request) {
b := bufPool.Get().([]byte)
for idx := range b {
b[idx] = 0
}
fmt.Fprintf(w, "done, %v", r.URL.Path[1:])
bufPool.Put(b)
})
http.ListenAndServe(":8080", nil)
}
其中 ab 输出的统计结果为:
1
2
3
4
5
6
7
8
9
10
11
12
13
14
15
16
17
18
19
20
21
22
23
24
25
26
27
28
29
30
31
32
33
34
35
36
37
38
39
40
41
42
43
44
45
46
47
48
49
$ ab -n 500 -c 100 http://127.0.0.1:8080/example2
This is ApacheBench, Version 2.3 <$Revision: 1843412 $>
Copyright 1996 Adam Twiss, Zeus Technology Ltd, http://www.zeustech.net/
Licensed to The Apache Software Foundation, http://www.apache.org/
Benchmarking 127.0.0.1 (be patient)
Completed 100 requests
Completed 200 requests
Completed 300 requests
Completed 400 requests
Completed 500 requests
Finished 500 requests
Server Software:
Server Hostname: 127.0.0.1
Server Port: 8080
Document Path: /example2
Document Length: 14 bytes
Concurrency Level: 100
Time taken for tests: 0.427 seconds
Complete requests: 500
Failed requests: 0
Total transferred: 65500 bytes
HTML transferred: 7000 bytes
Requests per second: 1171.32 [#/sec] (mean)
Time per request: 85.374 [ms] (mean)
Time per request: 0.854 [ms] (mean, across all concurrent requests)
Transfer rate: 149.85 [Kbytes/sec] received
Connection Times (ms)
min mean[+/-sd] median max
Connect: 0 1 1.4 1 9
Processing: 5 75 48.2 66 211
Waiting: 5 72 46.8 63 207
Total: 5 77 48.2 67 211
Percentage of the requests served within a certain time (ms)
50% 67
66% 89
75% 107
80% 122
90% 148
95% 167
98% 196
99% 204
100% 211 (longest request)
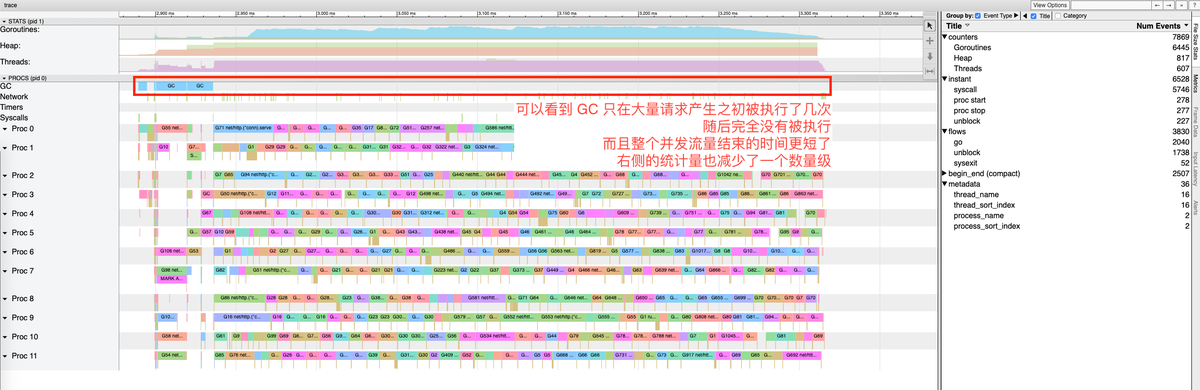
但从 Requests per second 每秒请求数来看,从原来的 506.63 变为 1171.32 得到了近乎一倍的提升。从 trace 的结果来看,GC 也没有频繁的被触发从而长期消耗 CPU 使用率:
sync.Pool 是内存复用的一个最为显著的例子,从语言层面上还有很多类似的例子,例如在例 1 中,concat 函数可以预先分配一定长度的缓存,而后再通过 append 的方式将字符串存储到缓存中:
1
2
3
4
5
6
7
8
9
10
11
12
13
14
15
16
17
18
19
func concat() {
wg := sync.WaitGroup{}
for n := 0; n < 100; n++ {
wg.Add(8)
for i := 0; i < 8; i++ {
go func() {
s := make([]byte, 0, 20)
s = append(s, "Go GC"...)
s = append(s, ' ')
s = append(s, "Hello"...)
s = append(s, ' ')
s = append(s, "World"...)
_ = string(s)
wg.Done()
}()
}
wg.Wait()
}
}
原因在于 + 运算符会随着字符串长度的增加而申请更多的内存,并将内容从原来的内存位置拷贝到新的内存位置,造成大量不必要的内存分配,先提前分配好足够的内存,再慢慢地填充,也是一种减少内存分配、复用内存形式的一种表现。
例3:调整 GOGC #
我们已经知道了 GC 的触发原则是由步调算法来控制的,其关键在于估计下一次需要触发 GC 时,堆的大小。可想而知,如果我们在遇到海量请求的时,为了避免 GC 频繁触发,是否可以通过将 GOGC 的值设置得更大,让 GC 触发的时间变得更晚,从而减少其触发频率,进而增加用户代码对机器的使用率呢?答案是肯定的。
我们可以非常简单粗暴的将 GOGC 调整为 1000,来执行上一个例子中未复用对象之前的程序:
1
$ GOGC=1000 ./main
这时我们再重新执行压测:
1
2
3
4
5
6
7
8
9
10
11
12
13
14
15
16
17
18
19
20
21
22
23
24
25
26
27
28
29
30
31
32
33
34
35
36
37
38
39
40
41
42
43
44
45
46
47
48
49
$ ab -n 500 -c 100 http://127.0.0.1:8080/example2
This is ApacheBench, Version 2.3 <$Revision: 1843412 $>
Copyright 1996 Adam Twiss, Zeus Technology Ltd, http://www.zeustech.net/
Licensed to The Apache Software Foundation, http://www.apache.org/
Benchmarking 127.0.0.1 (be patient)
Completed 100 requests
Completed 200 requests
Completed 300 requests
Completed 400 requests
Completed 500 requests
Finished 500 requests
Server Software:
Server Hostname: 127.0.0.1
Server Port: 8080
Document Path: /example2
Document Length: 14 bytes
Concurrency Level: 100
Time taken for tests: 0.923 seconds
Complete requests: 500
Failed requests: 0
Total transferred: 65500 bytes
HTML transferred: 7000 bytes
Requests per second: 541.61 [#/sec] (mean)
Time per request: 184.636 [ms] (mean)
Time per request: 1.846 [ms] (mean, across all concurrent requests)
Transfer rate: 69.29 [Kbytes/sec] received
Connection Times (ms)
min mean[+/-sd] median max
Connect: 0 1 1.8 0 20
Processing: 9 171 210.4 66 859
Waiting: 5 158 199.6 62 813
Total: 9 173 210.6 68 860
Percentage of the requests served within a certain time (ms)
50% 68
66% 133
75% 198
80% 292
90% 566
95% 696
98% 723
99% 743
100% 860 (longest request)
可以看到,压测的结果得到了一定幅度的改善(Requests per second 从原来的 506.63 提高为了 541.61), 并且 GC 的执行频率明显降低:
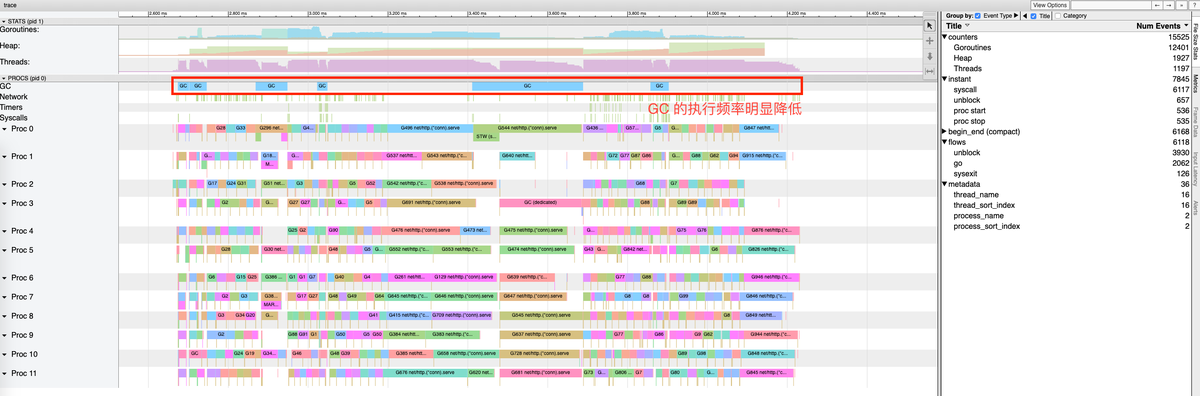
在实际实践中可表现为需要紧急处理一些由 GC 带来的瓶颈时,人为将 GOGC 调大,加钱加内存,扛过这一段峰值流量时期。
当然,这种做法其实是治标不治本,并没有从根本上解决内存分配过于频繁的问题,极端情况下,反而会由于 GOGC 太大而导致回收不及时而耗费更多的时间来清理产生的垃圾,这对时间不算敏感的应用还好,但对实时性要求较高的程序来说就是致命的打击了。
因此这时更妥当的做法仍然是,定位问题的所在,并从代码层面上进行优化。
小结 #
通过上面的三个例子我们可以看到在 GC 调优过程中 go tool pprof 和 go tool trace 的强大作用是帮助我们快速定位 GC 导致瓶颈的具体位置,但这些例子中仅仅覆盖了其功能的很小一部分,我们也没有必要完整覆盖所有的功能,因为总是可以通过http pprof 官方文档[7]、runtime pprof官方文档[8]以及 trace 官方文档[9]来举一反三。
现在我们来总结一下前面三个例子中的优化情况:
控制内存分配的速度,限制 goroutine 的数量,从而提高赋值器对 CPU 的利用率。
减少并复用内存,例如使用 sync.Pool 来复用需要频繁创建临时对象,例如提前分配足够的内存来降低多余的拷贝。
需要时,增大 GOGC 的值,降低 GC 的运行频率。
这三种情况几乎涵盖了 GC 调优中的核心思路,虽然从语言上还有很多小技巧可说,但我们并不会在这里事无巨细的进行总结。实际情况也是千变万化,我们更应该着重于培养具体问题具体分析的能力。
当然,我们还应该谨记 过早优化是万恶之源这一警语,在没有遇到应用的真正瓶颈时,将宝贵的时间分配在开发中其他优先级更高的任务上。
15. Go 的垃圾回收器有哪些相关的 API?其作用分别是什么? #
在 Go 中存在数量极少的与 GC 相关的 API,它们是
runtime.GC:手动触发 GC
runtime.ReadMemStats:读取内存相关的统计信息,其中包含部分 GC 相关的统计信息
debug.FreeOSMemory:手动将内存归还给操作系统
debug.ReadGCStats:读取关于 GC 的相关统计信息
debug.SetGCPercent:设置 GOGC 调步变量
debug.SetMaxHeap(尚未发布[10]):设置 Go 程序堆的上限值