采样方式

net/http/pprof

runtime/pprofimport _ "net/http/pprof"http.DefaultServeMux
package pprof

func init() {
	http.HandleFunc("/debug/pprof/", Index)
	http.HandleFunc("/debug/pprof/cmdline", Cmdline)
	http.HandleFunc("/debug/pprof/profile", Profile)
	http.HandleFunc("/debug/pprof/symbol", Symbol)
	http.HandleFunc("/debug/pprof/trace", Trace)
}
github.com/DeanThompson/ginpprofginpprof.Wrap(router)
package main

import (
	"github.com/gin-gonic/gin"
	"github.com/DeanThompson/ginpprof"
)

func main() {
	router := gin.Default()
	
	// automatically add routers for net/http/pprof
	// e.g. /debug/pprof, /debug/pprof/heap, etc.
	ginpprof.Wrap(router)
	// ginpprof also plays well with *gin.RouterGroup
	// group := router.Group("/debug/pprof")
	// ginpprof.WrapGroup(group)
}

benchmark pprof

go test -bench  -run none -cpuprofile -cpuprofile-benchmem -memprofile-blockprofile

runtime/pprof

cpu.profmem.prof
import "runtime/pprof"

func main() {
    f, _ := os.Create("cpu.prof")
    pprof.StartCPUProfile(f)
	defer pprof.StopCPUProfile()
    
    ff, _ := os.Create("mem.prof")
    pprof.WriteHeapProfile(ff)
    
    // 待测试的程序
}

采样频率

在这里插入图片描述

报告查看
protobufruntime.SetBlockProfileRate(1)runtime.SetMutexProfileFraction(1)

命令行模式

pprof [options] [binary] go tool pprof http:///debug/pprof/[?seconds=120]secondsgo tool pprof toptraceslist top -cumtraces - - - - -list 

[外链图片转存失败,源站可能有防盗链机制,建议将图片保存下来直接上传(img-nCJzWFvK-1582979745701)(C:\Users\35135\AppData\Roaming\Typora\typora-user-images\1582979123139.png)]

浏览器模式

pprof -http [host]:[port] [options] [binary] wgetcurlscpTopGraphFlame Graphgraphvizbrew install graphvizapt install graphvizSource

在这里插入图片描述

--nodecount=<n>    Show at most so many nodes [default=80]
--nodefraction=<f> Hide nodes below <f>*total [default=.005]
--edgefraction=<f> Hide edges below <f>*total [default=.001]
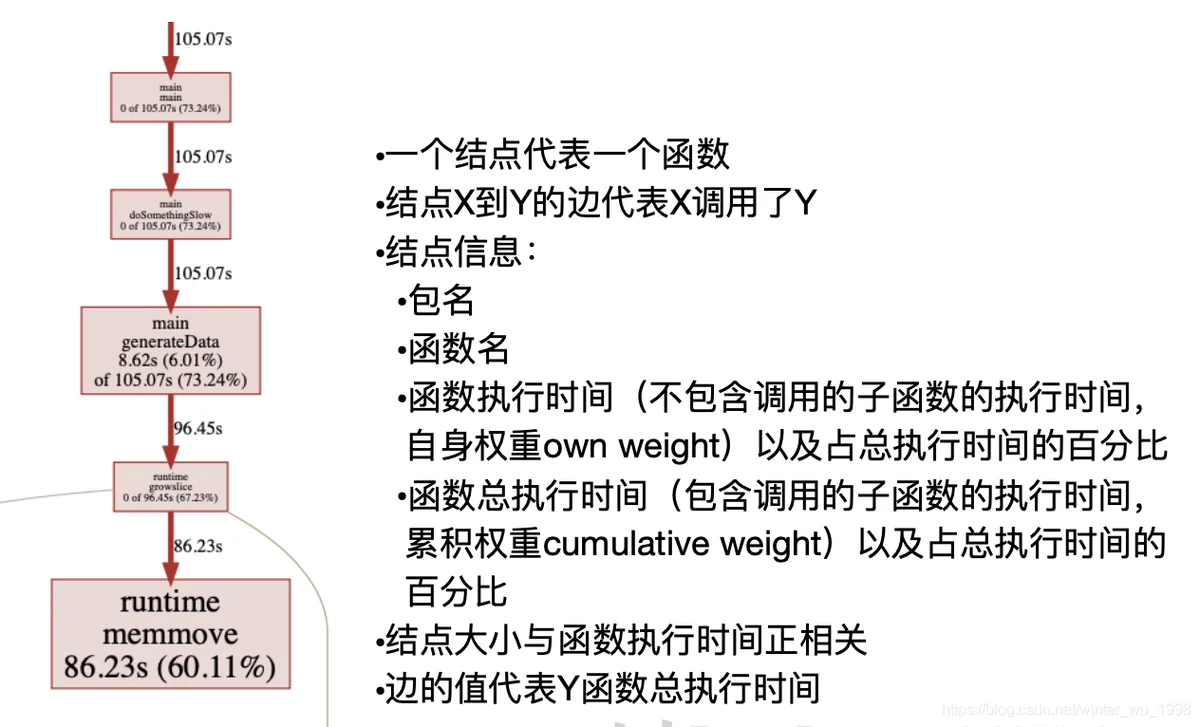
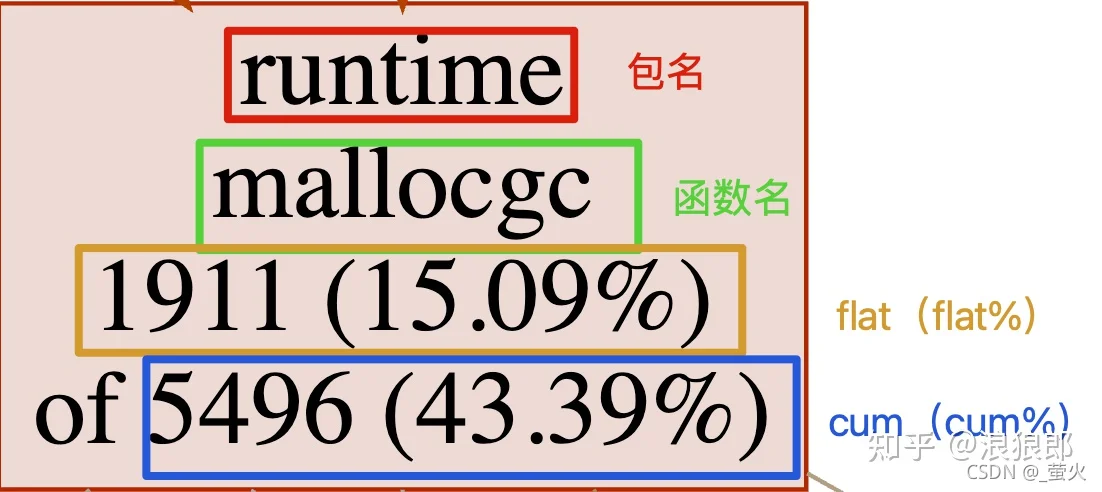
在这里插入图片描述
在这里插入图片描述

Flame Graph

使用源代码

listsourceError: could not find file xx on path xxx-source_path-trim_path$GOPATH/personal/demo_old$GOPATH/personal/demo_newgo tool pprof -source_path=$GOPATH/personal/demo_new -trim_path=$GOPATH/personal/demo_old /ln -sln -s $GOPATH /opt/xxx/compile_path
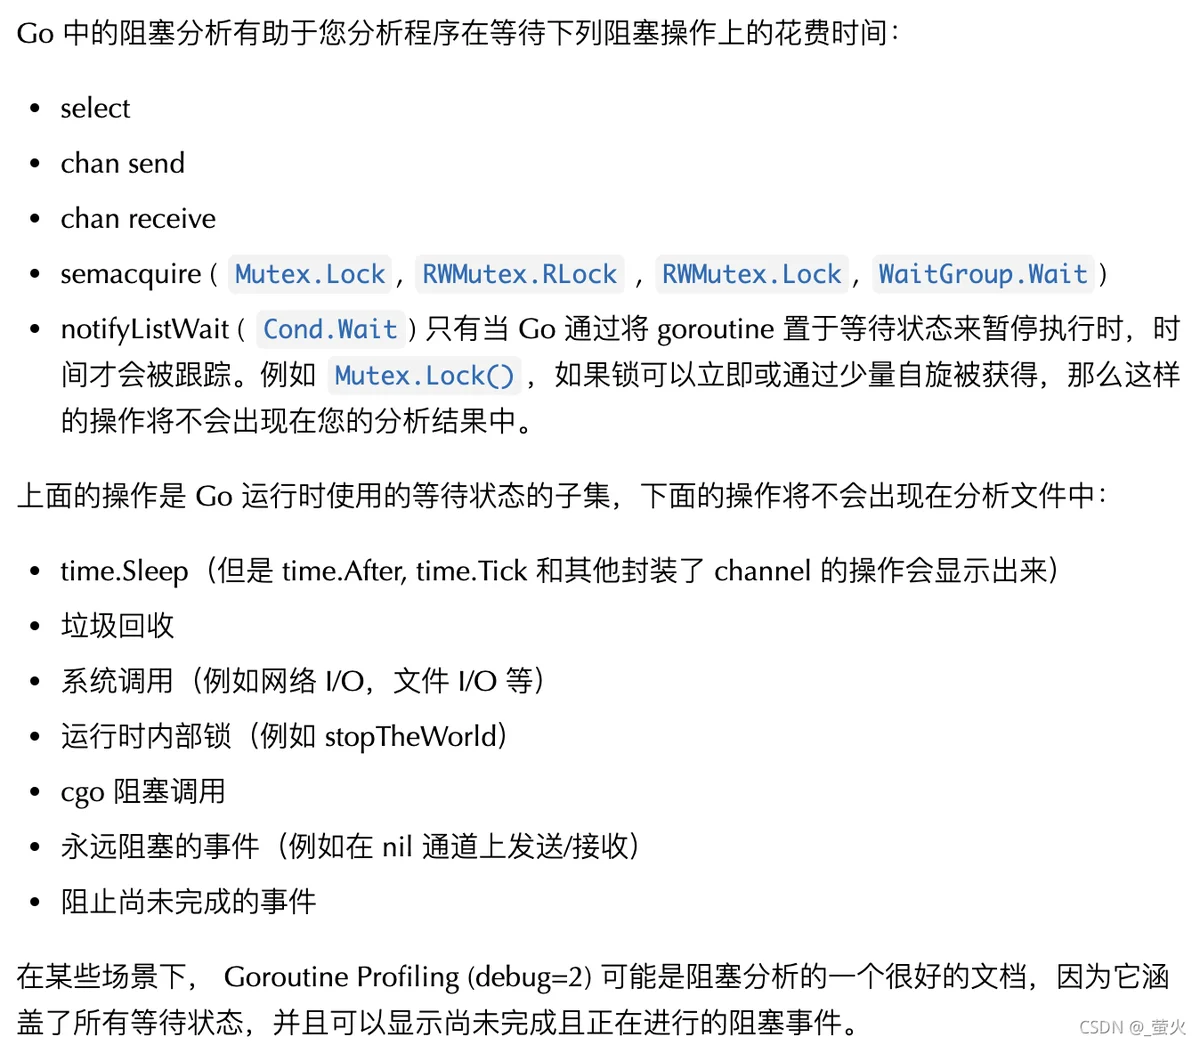
指标分析

CPU

  • CPU 性能分析启用后,Go runtime 会每 10ms 就暂停一下,记录当前运行的 goroutine 的调用堆栈及相关数据
    • 出现频率较高的函数则CPU占用较高
  • 该指标记录的耗时是主动消耗CPU的时间(on-cpu),不包括I/O等待和sleeping等时间(off-cpu)
    • 对于IO消耗型的任务on-cpu并不能代表任务大部分的时间消耗在了哪里

off-cpu

  • off-cpu包括:
    • 进程进入系统调用执行(磁盘、网络)io动作的时间
    • 进程等待mutex锁的时间
    • 内存被交换,swap的时间
    • 内存不够的时候,执行直接内存回收的时间
    • 进程被抢占调度走、或者时间片用完被调度走的时间

耗时分析

runtime.GoruntineProfile

内存

inuseallocgo tool pprof-sample_indexgo tool pprof -sample_index=alloc_space http:///debug/pprof/heapgo tool pprof -base  toplistmProf_MallocmProf_Freeinused_spacerssdebug/pprof/heap?debug=1runtime.MemStats

goroutine

在这里插入图片描述

go tool pprof -base
goroutine?debug=1
  • 查看某条调用路径上,当前阻塞在此goroutine的数量
  • 不会列出单独的 goroutines 信息,把拥有相同堆栈信息和标签的 goroutines 和他们的数量一起列出
goroutine profile: total 32023
32015 @ 0x42e15a 0x42e20e 0x40534b 0x4050e5 0x6d8559 0x6d831b 0x45abe1
#    0x6d8558    main.alloc2.func1+0xf8    /home/ubuntu/heap/leak_demo.go:53
#    0x6d831a    main.alloc2+0x2a    /home/ubuntu/heap/leak_demo.go:54
goroutine profile: total 3202332015 @ 0x42e15a 0x42e20e 0x40534b 0x4050e5 ...# 0x6d8558 main.alloc2.func1+0xf8 /home/ubuntu/heap/leak_demo.go:53
goroutine?debug=2
  • 查看所有goroutine的运行栈(调用路径)
  • 可以显示该gorotine当前在干什么以及阻塞在此的时间
    • 以分钟为单位包含在内,但前提是持续时间超过 1 分钟
  • 最上方显示的是当前运行的goroutine
goroutine 20 [chan send, 2 minutes]:
main.alloc2.func1(0xc42015e060)
    /home/ubuntu/heap/leak_demo.go:53 +0xf9 
main.alloc2(0xc42015e060)
    /home/ubuntu/heap/leak_demo.go:54 +0x2b
created by main.alloc1
    /home/ubuntu/heap/leak_demo.go:42 +0x3f
goroutine 20 [chan send, 2 minutes]20[]

在这里插入图片描述

  • 参考:

阻塞(mutex & block)

  • block分析用法
    在这里插入图片描述

  • block并不能分析大部分的耗时之处,主要用于分析锁和channel(即并发相关)的操作消耗
    在这里插入图片描述

  • mutex和block指标的关系
    在这里插入图片描述

  • 借助CPU分支预测技术,block在不开启时几乎没有消耗

在这里插入图片描述