一个可以实时查看golang程序内存、CPU、GC、协程等变化情况的可视化工具,很好用。
安装:
使用:
跟pprof一样, import, 然后开端口监听就行了。
运行后,浏览器打开 http://localhost:8080/debug/charts/ 就能看到了。
这里是官方的例子:
package main

import (
	"fmt"
	"log"
	"net/http"
	"runtime"
	"time"

	_ "net/http/pprof"

	"github.com/gorilla/handlers"
	_ "github.com/mkevac/debugcharts"
)

func dummyCPUUsage() {
	var a uint64
	var t = time.Now()
	for {
		t = time.Now()
		a += uint64(t.Unix())
	}
}

func dummyAllocations() {
	var d []uint64

	for {
		for i := 0; i < 2*1024*1024; i++ {
			d = append(d, 42)
		}
		time.Sleep(time.Second * 10)
		fmt.Println(len(d))
		d = make([]uint64, 0)
		runtime.GC()
		time.Sleep(time.Second * 10)
	}
}

func main() {
	go dummyAllocations()
	go dummyCPUUsage()
	go func() {
		log.Fatal(http.ListenAndServe(":8080", handlers.CompressHandler(http.DefaultServeMux)))
	}()
	log.Printf("you can now open http://localhost:8080/debug/charts/ in your browser")
	select {}
}
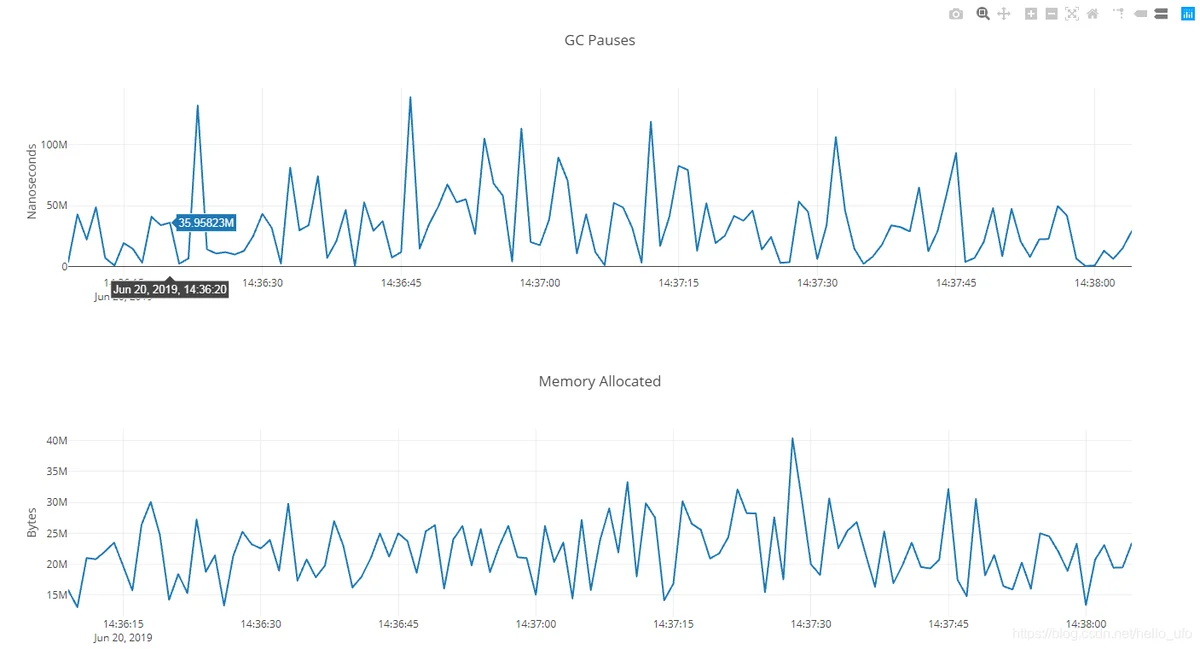
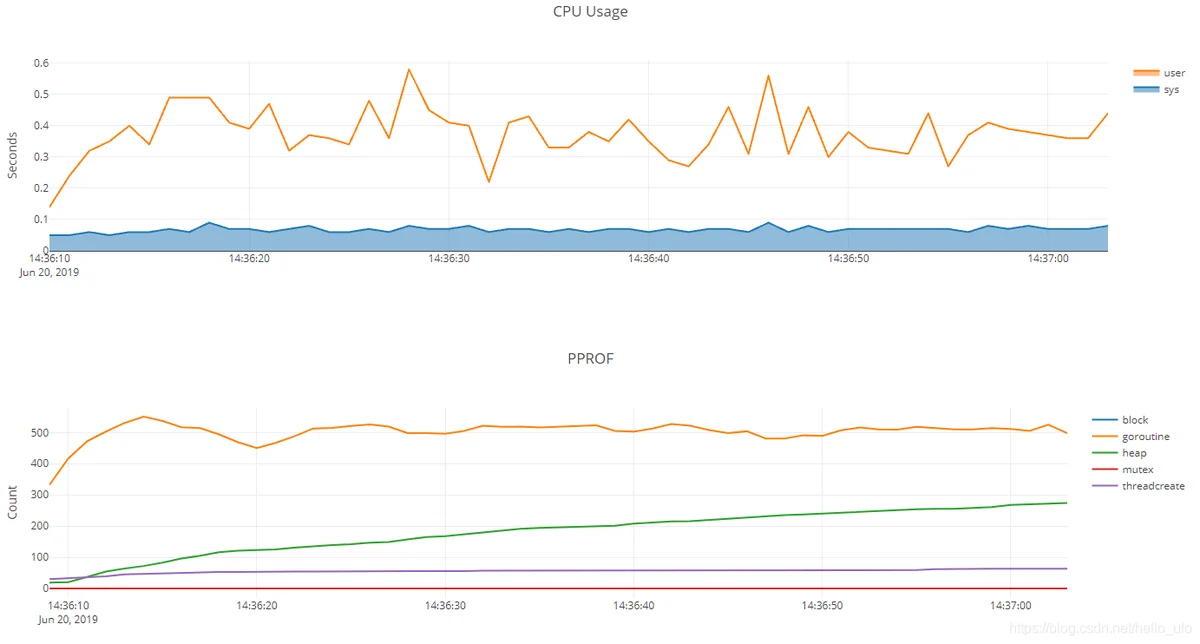
看下效果:
可以实时查看内存、CPU、协程、GC的情况, 刷新频率为一秒。