本篇内容介绍了“如何理解golang逃逸分析”的有关知识,在实际案例的操作过程中,不少人都会遇到这样的困境,接下来就让小编带领大家学习一下如何处理这些情况吧!希望大家仔细阅读,能够学有所成!
背景
最近想要将 protobuf 变量和之前设计的数据对象整合起来,维护在内存中,以减少内存申请和 GC 的性能损耗。
feature or bug,gogoproto 解码疑惑
unmarshalunmarshalresetresetfunc (m *Data) Reset() { *m = Data{} }Data{}resetunmarshalreset那么,难道一开始的方向就错了吗?啊头秃。
柳暗花明又一村
不死心的我开始看各种文档,包括 gogoproto 的各种插件,可惜并没有找到有用的内容。接着我又开始看官方 proto 文档。。。
这时我发现了一点蛛丝马迹。
在日常使用 protobuf 时,如果不复用旧的变量,我们一般会
data := &pb.Data{}proto.Unmarshal(bytes, data)unmarshalreset真的吗,我不信。
逃逸分析入门
想的太多,不如写个 benchmark 试一下。(小心 microbenchmark 的一些坑)
benchmark
package main

import (
	"testing"
)

type boy struct {
	name string
	age  int
}

var b1 = &boy{}
var b2 = &boy{}

func Benchmark_1(b *testing.B) {

	for i := 0; i < b.N; i++ {
		temp := &boy{}
		b1 = temp
	}
}

func Benchmark_2(b *testing.B) {

	for i := 0; i < b.N; i++ {
		temp := &boy{}
		*b1 = *temp
	}
}

func Benchmark_3(b *testing.B) {

	for i := 0; i < b.N; i++ {
		temp := &boy{}
		*b1 = *temp
		b2 = temp
	}
}
结果如下。
goos: linux
goarch: amd64
pkg: bible
Benchmark_1-4   	29142411	        42.2 ns/op	      32 B/op	       1 allocs/op
Benchmark_2-4   	1000000000	         0.711 ns/op	       0 B/op	       0 allocs/op
Benchmark_3-4   	28474614	        39.5 ns/op	      32 B/op	       1 allocs/op
PASS
ok  	bible	3.258s
temp := &boy{}编译报告
到此,只需要逐个分析就好。首先打开编译报告看一下。
go build -gcflags "-m -m"var b1 = &boy{}
//go:noinline
func main() {
temp := &boy{}
// &boy literal escapes to heap:
// flow: temp = &{storage for &boy literal}:
// from &boy literal (spill) at ./main.go:12:10
// from temp := &boy literal (assign) at ./main.go:12:7
// flow: {heap} = temp:
// from b1 = temp (assign) at ./main.go:13:5
// &boy literal escapes to heap
b1 = temp
}&boy{}var b1 = &boy{}
//go:noinline
func main() {
temp := &boy{}
// &boy literal does not escape
*b1 = *temp
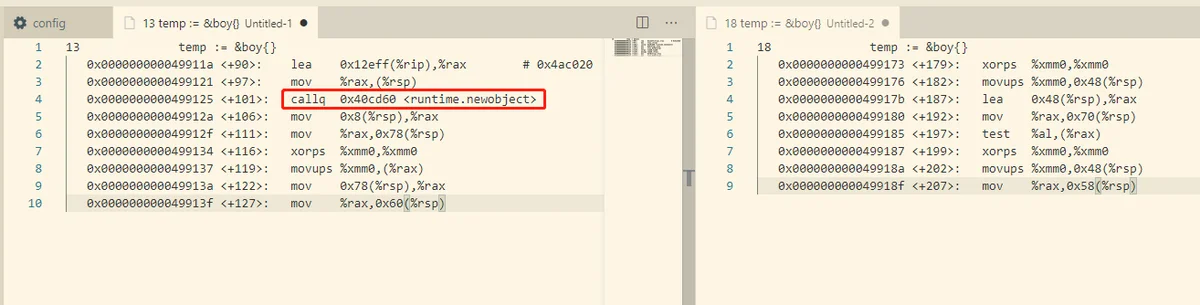
}*b1 = *temp&boy{}汇编分析