
每日一课,不论长短,有所学有所得
业精于勤技在专,行则将至事必成
给大家分享一些书籍,希望能够提供一些帮助
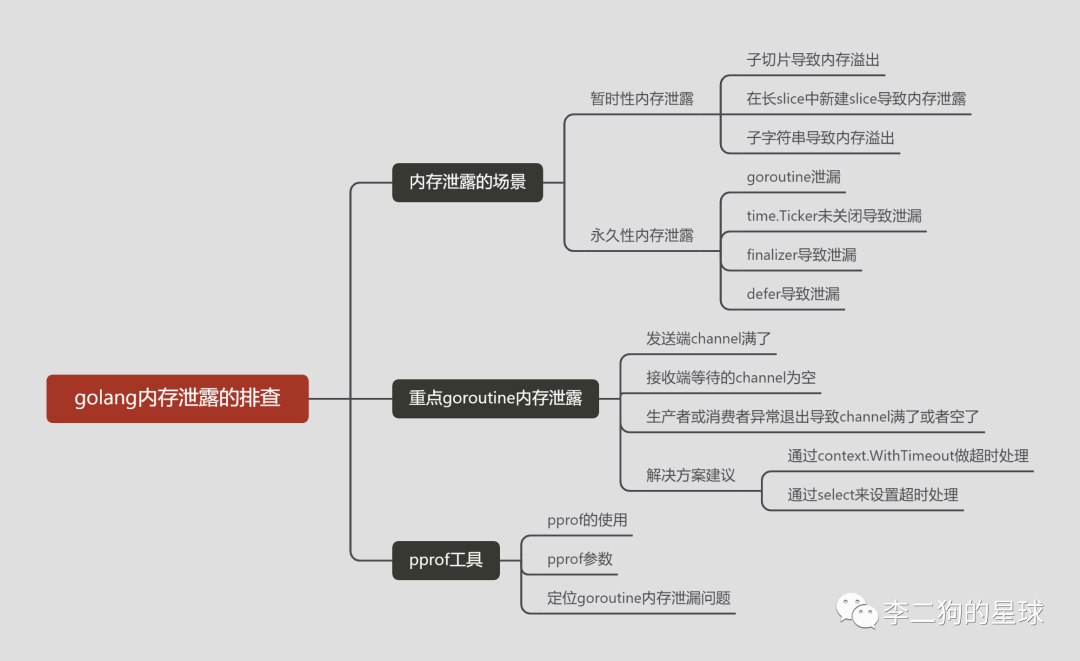
上篇内容我们介绍了golang中可能导致内存泄露的一些情况,属于预防阶段,但是我们可能又很难保证自己的经验和能力,以及对线上代码的掌控力,因此如何对已经运行的代码进行内存泄露的排查和发现,就需要通过监控的方法了。
pprof是go的可视化性能分析工具,它可以记录程序运行的过程中的一些cpu,内存,协程的运行情况,当需要性能调优或者定位一些bug的时候,可以通过该工具作为辅助。
runtime/pprofnet/http/pprofnet/http/pprofpprof的使用
开始一个简单的demo:
第一步:添加代码:
package main

import (
    "fmt"
    "net/http"
    _ "net/http/pprof" // 引入pprof库
)

func main() {
    //  制造一个协程泄露事件
    for i := 0; i < 5; i++ {
        go func() {
            select {
            default:
                return
            } // 不阻塞
        }()
        go func() {
            select {} // 泄漏了 1000 个协程
        }()
}

    // 开启pprof的监听端口
    if err := http.ListenAndServe(":6069", nil); err != nil {
        fmt.Printf("start pprof failed")
}
}
第二步:运行代码后,浏览器查看/命令行查看
http://127.0.0.1:6069/debug/pprof/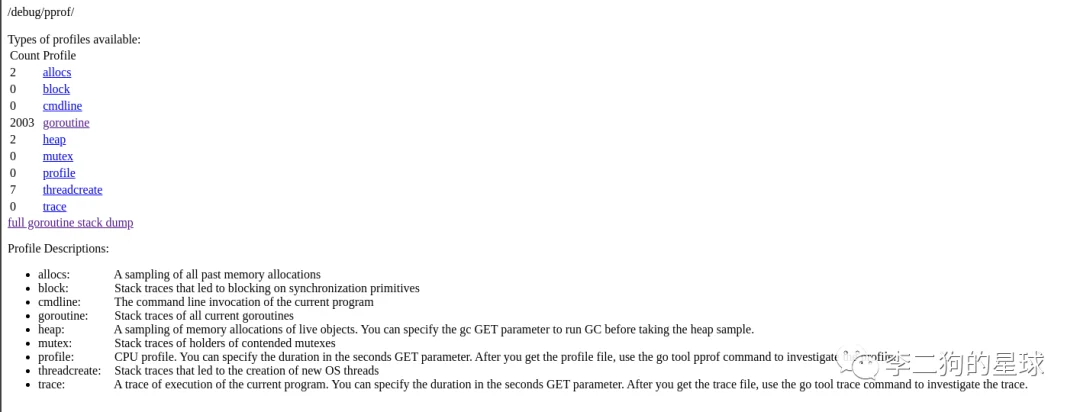
或者通过命令行下载数据到本地进行分析:
# 下载cpu profile,默认从当前开始收集30s的cpu使用情况,需要等待30s
# 30-second CPU profile
go tool pprof http://localhost:6069/debug/pprof/profile
# wait 120s
go tool pprof http://localhost:6069/debug/pprof/profile?seconds=120

# 下载heap profile
go tool pprof http://localhost:6069/debug/pprof/heap

# 下载goroutine profile
go tool pprof http://localhost:6069/debug/pprof/goroutine

# 下载block profile
go tool pprof http://localhost:6069/debug/pprof/block

# 下载mutex profile
go tool pprof http://localhost:6069/debug/pprof/mutex
pprof参数
以上使用pprof的demo已启动完成,接下来我们的重点就是怎么用怎么看pprof的各种参数。
pprof web首页中的几个参数:
allocs: 内存分配情况
block: 阻塞堆栈的信息
cmdline: 程序启动命令及其参数
goroutine: 当前协程的堆栈信息
heap: 堆内存的信息
mutex: 锁竞争的信息
profile: cpu使用情况的信息
threadcreate: 系统程序创建情况的信息
trace: 程序运行的跟踪信息
full goroutine stack dump: 输出所有goroutine的调用栈,是goroutine的debug=2
定位goroutine内存泄露问题
我们重点关注的goroutine相关的参数(因为大部分的内存泄露是协程导致的):goroutine,full goroutine stack dump
第一步:查看goroutine:http://127.0.0.1:6069/debug/pprof/goroutine?debug=1
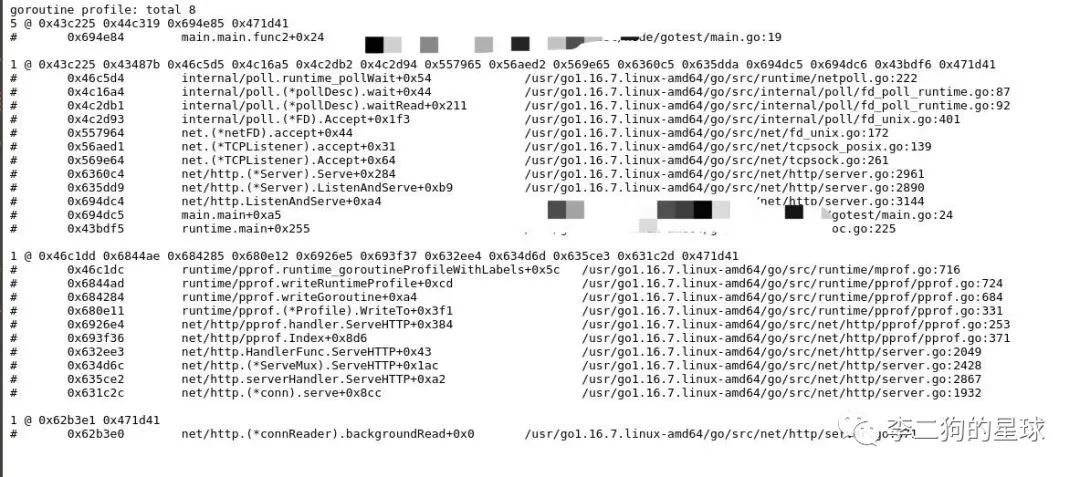
goroutine profile: total 85 @ 0x43c225 0x44c319 0x694e85 0x471d41/gotest/main.go:19第二步:full goroutine stack dump:http://127.0.0.1:6069/debug/pprof/goroutine?debug=2
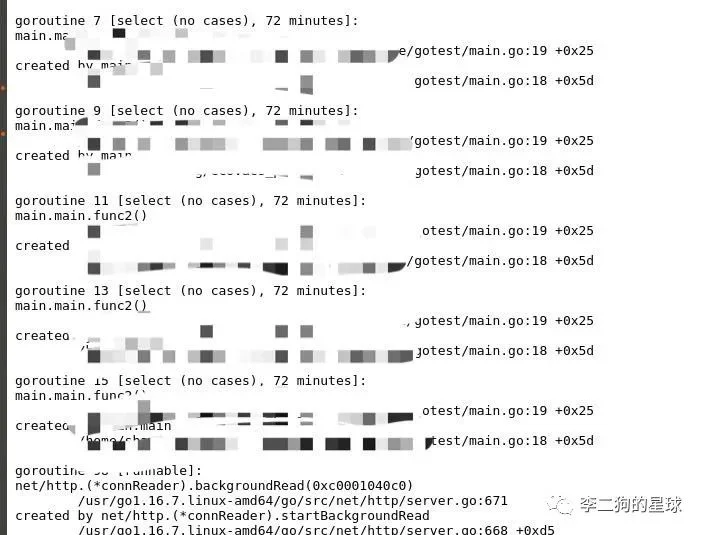
goroutine 7 [select (no cases), 72 minutes]:chan receive, 4minuteschan send, 4minutes/gotest/main.go:19 +0x25以上两步骤结合一起,可以简单快速的定位出goroutine导致的内存溢出。
总结:
string和slice不正确的使用会引起短暂的内存泄露
一些句柄的连接未释放会触发内存泄露
最主要的内存泄露还是在协程的内存泄露(本质是channel的阻塞),因此goroutine的正确使用很重要
一是认真学习好代码的知识点避免使用错误,二是借助工具review和排查代码
补充
本文中缺少对pprof的命令行使用方法的介绍,但其实大同小异,命令行方法适合在没有浏览器可访问的时候使用。
goroutine?debug=1goroutine?debug=2go tool pprof http://0.0.0.0:6069/debug/pprof/goroutineOptiPlex-3050:~/gotest$ go tool pprof http://0.0.0.0:6069/debug/pprof/goroutine
Fetching profile over HTTP from http://0.0.0.0:6069/debug/pprof/goroutine
Saved profile in /home/xxx/pprof/pprof.main.goroutine.002.pb.gz
File: main
Type: goroutine
Time: Jan 24, 2022 at 2:00pm (CST)
Entering interactive mode (type "help" for commands, "o" for options)
(pprof)
pprof的使用命令行查看接下来就可以通过命令行操作对已下载到本地的数据进行分析了,我们只需要记住三个指令(top+traces+list)的用法:
top用法:按指标大小列出前10个函数,比如内存是按内存占用多少,CPU是按执行时间多少;
(pprof) top
Showing nodes accounting for 8, 100% of 8 total
Showing top 10 nodes out of 27
      flat  flat%   sum%        cum   cum%
         6 75.00% 75.00%          6 75.00%  runtime.gopark
         1 12.50% 87.50%          1 12.50%  net/http.(*connReader).backgroundRead
        ...
/**
flat: 本函数占用的内存量。
flat%: 本函数内存占使用中内存总量的百分比。
sum%: 前面每一行flat百分比的和,比如第2行虽然的100% 是 100% + 0%。
cum: 是累计量,加入main函数调用了函数f,函数f占用的内存量,也会记进来;此处cum表示协程数量
cum%: 是累计量占总量的百分比。
**/
// runtime.gopark表示挂起状态
// 此处cum表示协程阻塞的数量
traces用法:打印所有调用栈,以及调用栈的指标信息。
(pprof) traces
File: main
Type: goroutine
Time: Jan 24, 2022 at 2:00pm (CST)
-----------+-------------------------------------------------------
         5   runtime.gopark
             runtime.block
             main.main.func2
-----------+-------------------------------------------------------
...
// 5   runtime.gopark 表示有5个阻塞的协程都执行此调用栈
list mainmain.mainruntime.main(pprof) list main.main.func2
Total: 8
ROUTINE ======================== main.main.func2 in /home/shawanning/ecovacs_project/test/node/gotest/main.go
0 5 (flat, cum) 62.50% of Total
. . 14: default:
. . 15: return
. . 16: } // 不阻塞
. . 17: }()
. . 18: go func() {
. 5 19: select {} // 泄漏了 1000 个协程
. . 20: }()
. . 21: }
. . 22:
. . 23: // 开启pprof的监听端口
. . 24: if err := http.ListenAndServe(":6069", nil); err != nil {
// 通过list指定该调用栈,可以查看其代码,但前提是服务器中必须有未打包的源码;因此还是推荐我们通过web的访问方式去排查问题更方便
graphviz预告:
明天去外地参加朋友的婚礼,可能就没法更文了。
恭喜我的朋友新婚快乐!愿长长久久!